Results

Results Module
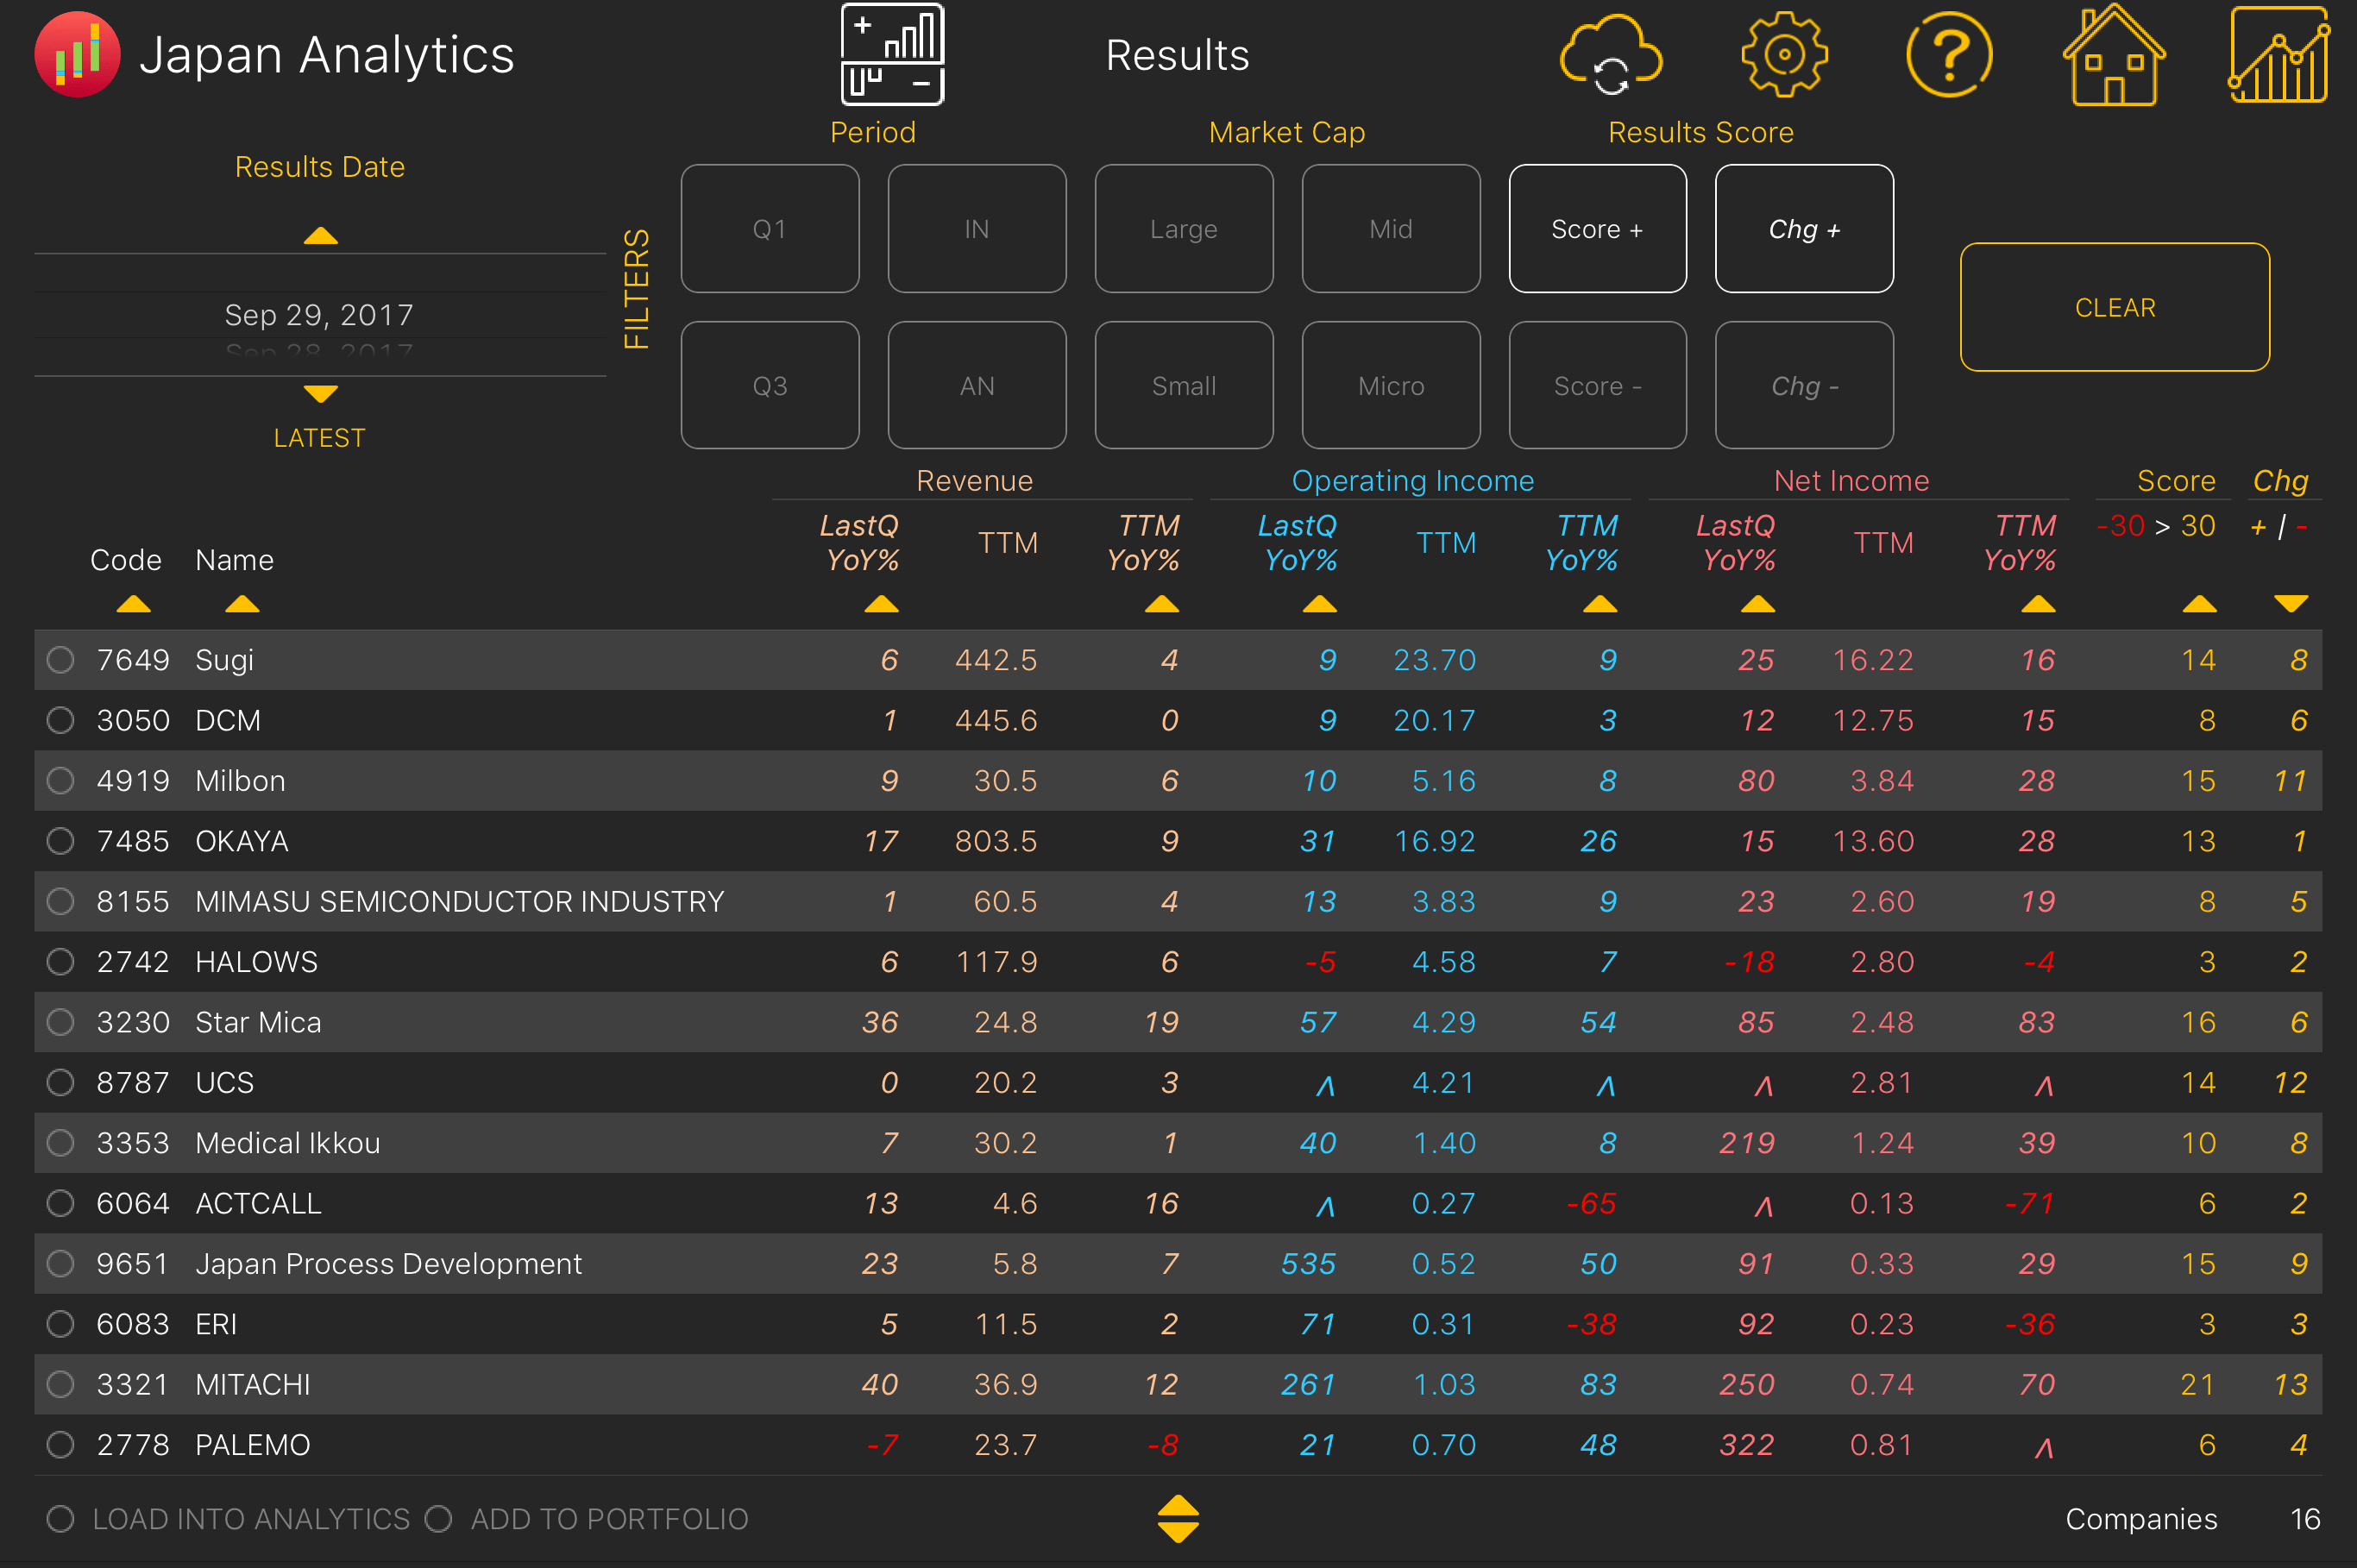
The Japan Analytics Results Module shows the most recent quarterly results for all listed companies sorted by date of release. Results can then be filtered by Quarter, Market Cap and Results Score. The data covers Revenue, Operating Income and Net Income.
The module will initially load the results announced on the previous business day. Results announced on earlier dates can be accessed by scrolling the date wheel. The number of companies with results that day appears in the bottom right.
Results data differs from that released by the companies which uses cumulative quarters for the income statement. Our analysis automatically parses the data into adjusted three-month quarters which allows for a comparison with the same quarter of the previous year as well as the current trailing twelve months and the trailing twelve month period one year before. The absolute trailing twelve-month (TTM) amount is also shown.
Results Score
The earnings announcements made by Japanese listed companies can be confusing as the Income Statement is reported in terms of cumulative months to date in the fiscal year. In order to analyze quarter-on-quarter and trailing twelve month changes it is necessary to adjust the disclosures into discreet quarters. In the App we default to quarterly adjusted Income Statements and trailing twelve-month (TTM) data.
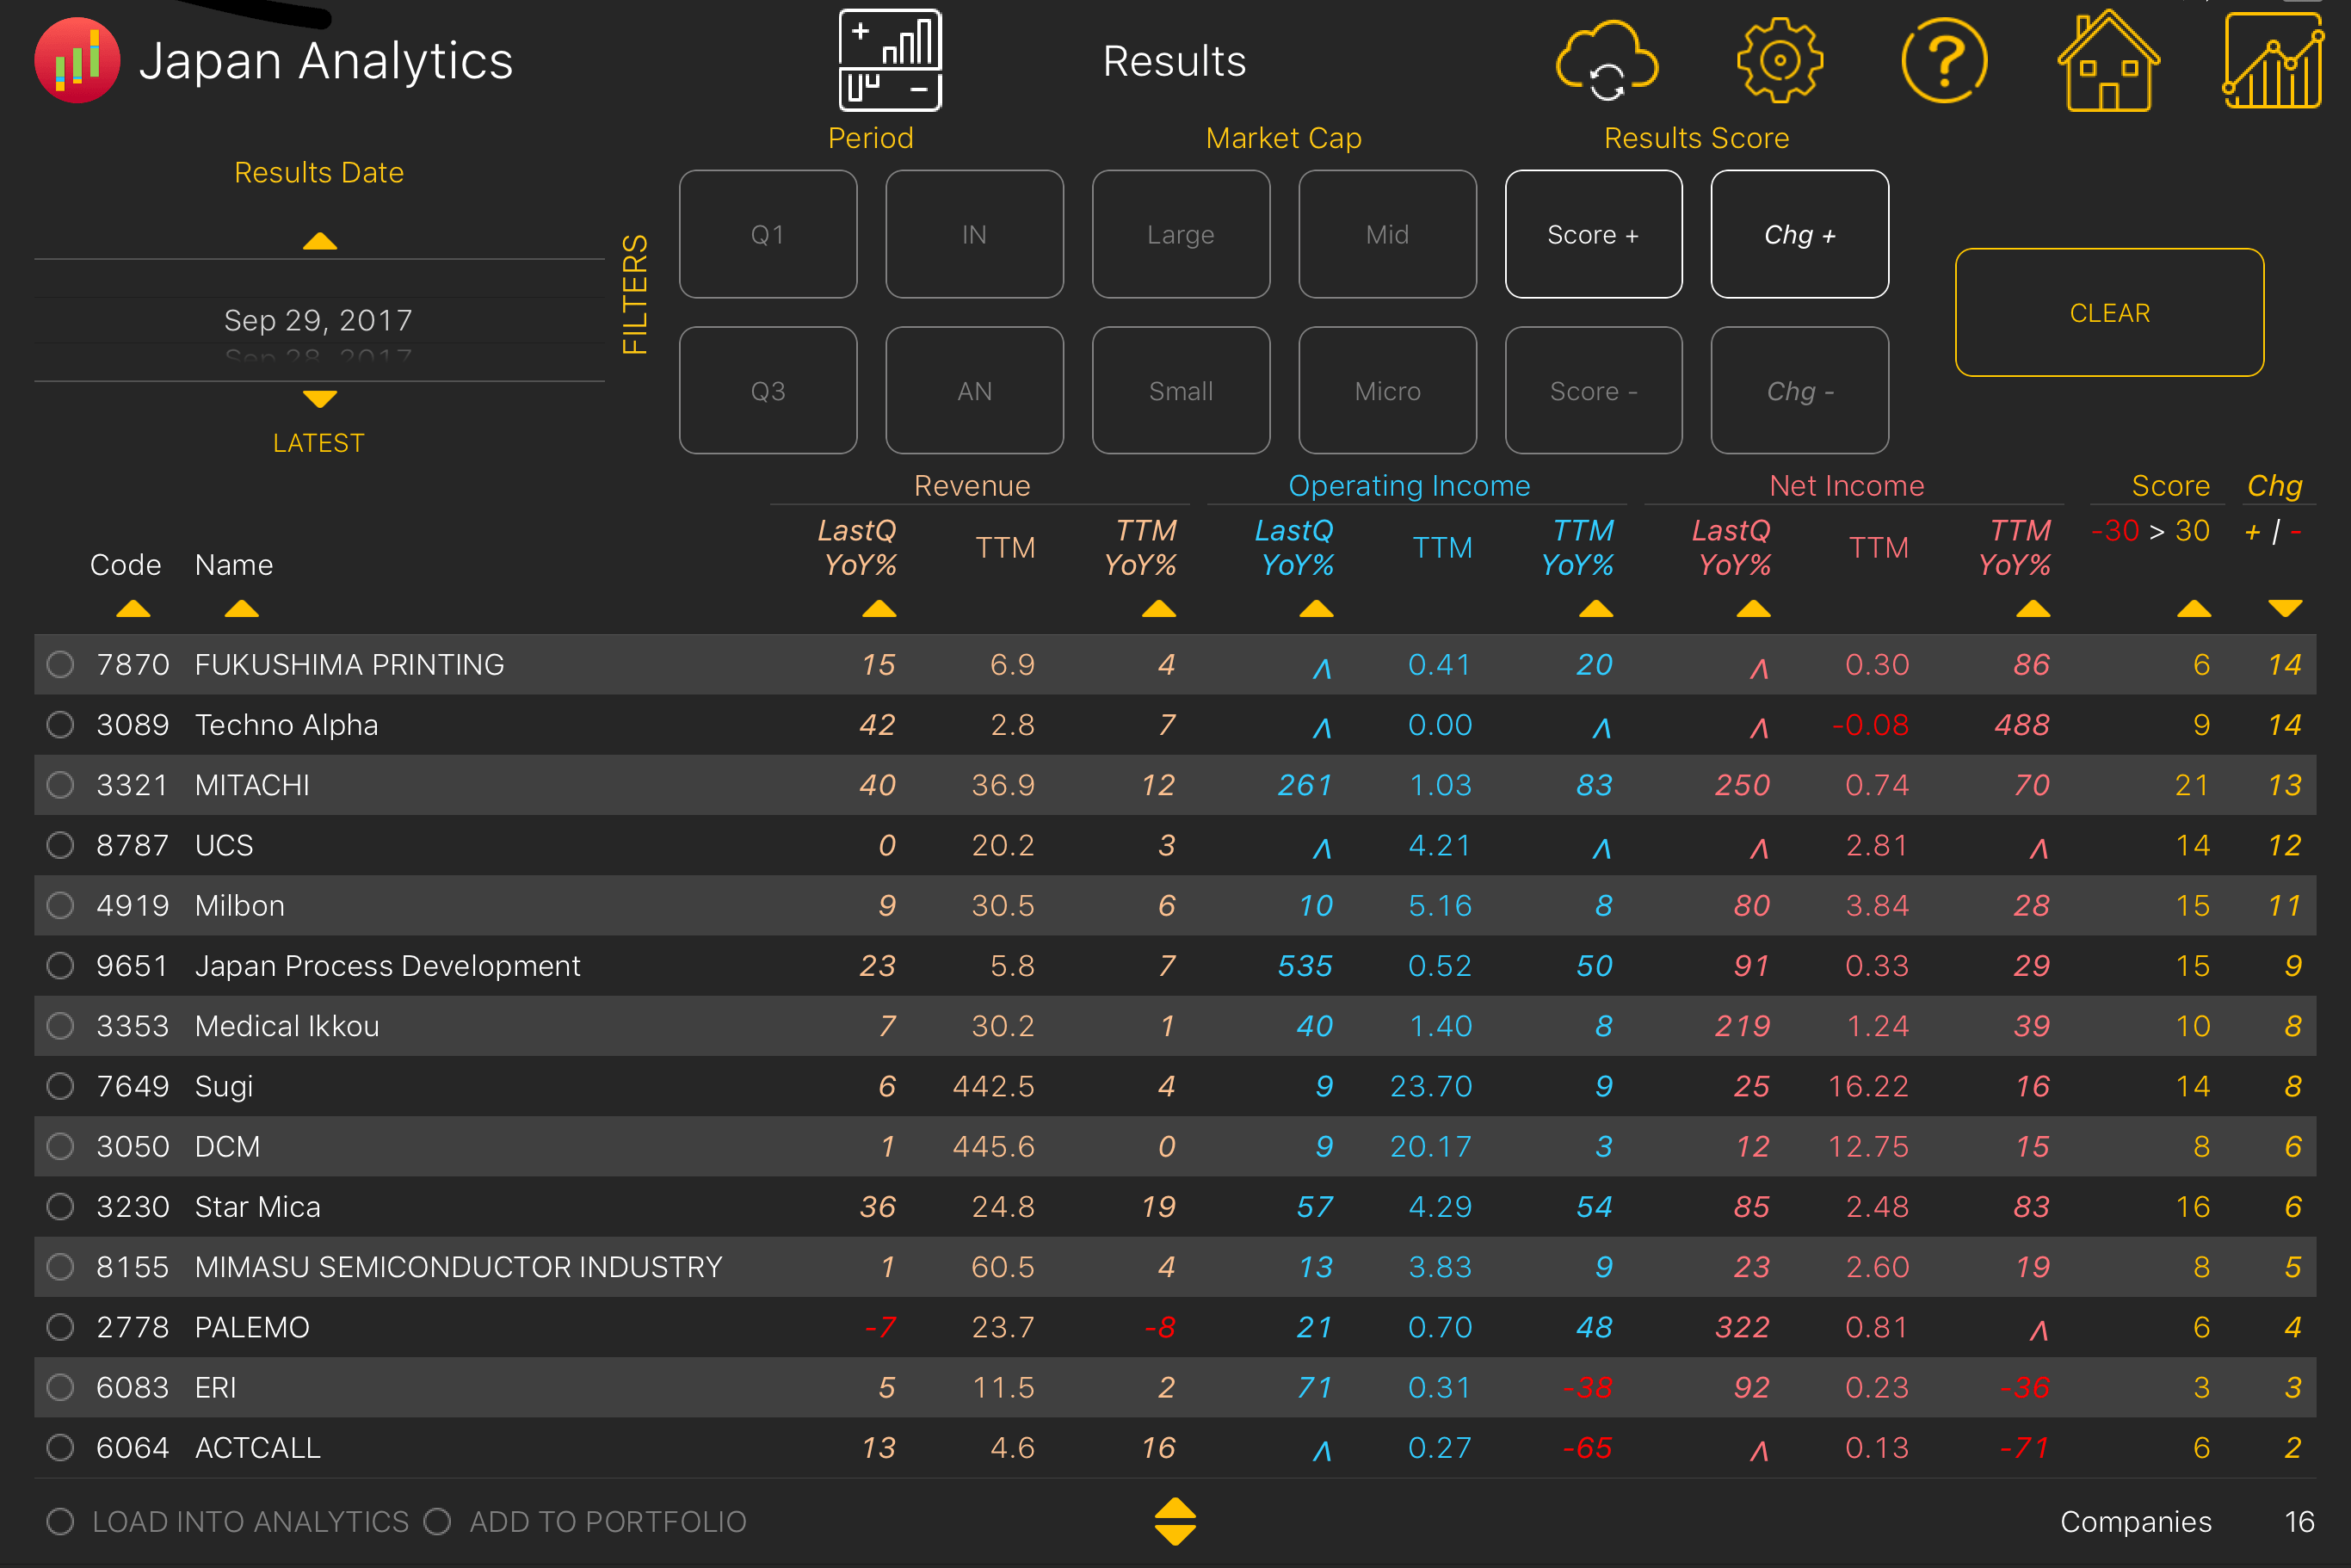
The Results Score is a measure of earnings results and momentum which covers the last eight quarters of Revenue and Operating Income. The score has a maximum of 30 and minimum of -30. Where there is insufficient data the score will be 0. Chg +/- is the change in the Score from the last Results Score.
The current top and bottom large cap companies measured by Result Score are shown in the tables below.


Filters
Results announced on a particular day can be filtered by Quarter, Market Cap or Results Score. Quarter Filters are by the last quarterly period reported, first quarter (Q1), second quarter (IN), third quarter (Q3) or fourth quarter (AN). Market Cap Filters are by market capitalization quartile as of the last business day. The Results Score Filters filters by positive (Score+) and negative (Score-) Results Scores and by positive (Chg+) and negative (Chg-) 3 month change in Results Score. When at least one filter is tapped on, the CLEAR button will change color and become enabled. Tap on the CLEAR button at any time to return to the full list of results for the day.
Filter by Period

Filter by Market Cap

Filter by Results Score

Sorting
Companies are initially presented in descending order of Market Cap. The list can be sorted by Code, Name, the last quarter’s year-on-year change and the trailing twelve-month year-on-year change in Revenue/Ordinary Income, Operating Income/Ordinary Profit and Net Income as well as Results Score and the change in Results Score. Sorting is possible by tapping on any of the sort arrows. Tap once again to reverse the sort order.
