
Analysis

Analysis Module
The Japan Analytics Analysis Module is the key analytical module in the App. An innovative approach to financial data visualization provides users with ready access to all key corporate financial and accounting data by means of 144 charts covering 530 data series for non-financial companies and 12 charts covering between 41 to 78 data series for financial companies. Every chart is no more than three taps away from any point in the App.
Up to 28 years of annual and 28 quarters of adjusted quarterly data from the Income Statement and Balance Sheet are presented 'as disclosed' as well as reformulated to separate Operating and Financing activities.
Derived Annual and Quarterly Cash Flow Statements follow a 'clean-surplus' methodology. Returns are fully decomposed into their constituent parts and the effects of both Operating and Financial Leverage re highlighted. In addition to traditional measures of value, a Residual Income approach is applied to the company's disclosed historical and prior forecasts as well as the most recent 12 months and current forecasts.
The 144 charts for non-financial companies are accessed through 12 sub-module windows covering the Income Statement, Income Statement Analysis, Comprehensive Income, Balance Sheet, Balance Sheet Analysis, Quarterly and Annual Cash Flow, Returns, Residual Income, Shares, Valuation and Supplemental.
Companies within the same peer group can be compared by swiping up and down in either the 12 or single charts views or by selecting the company's stock code from the list on the left of the screen.
Non Financial Companies
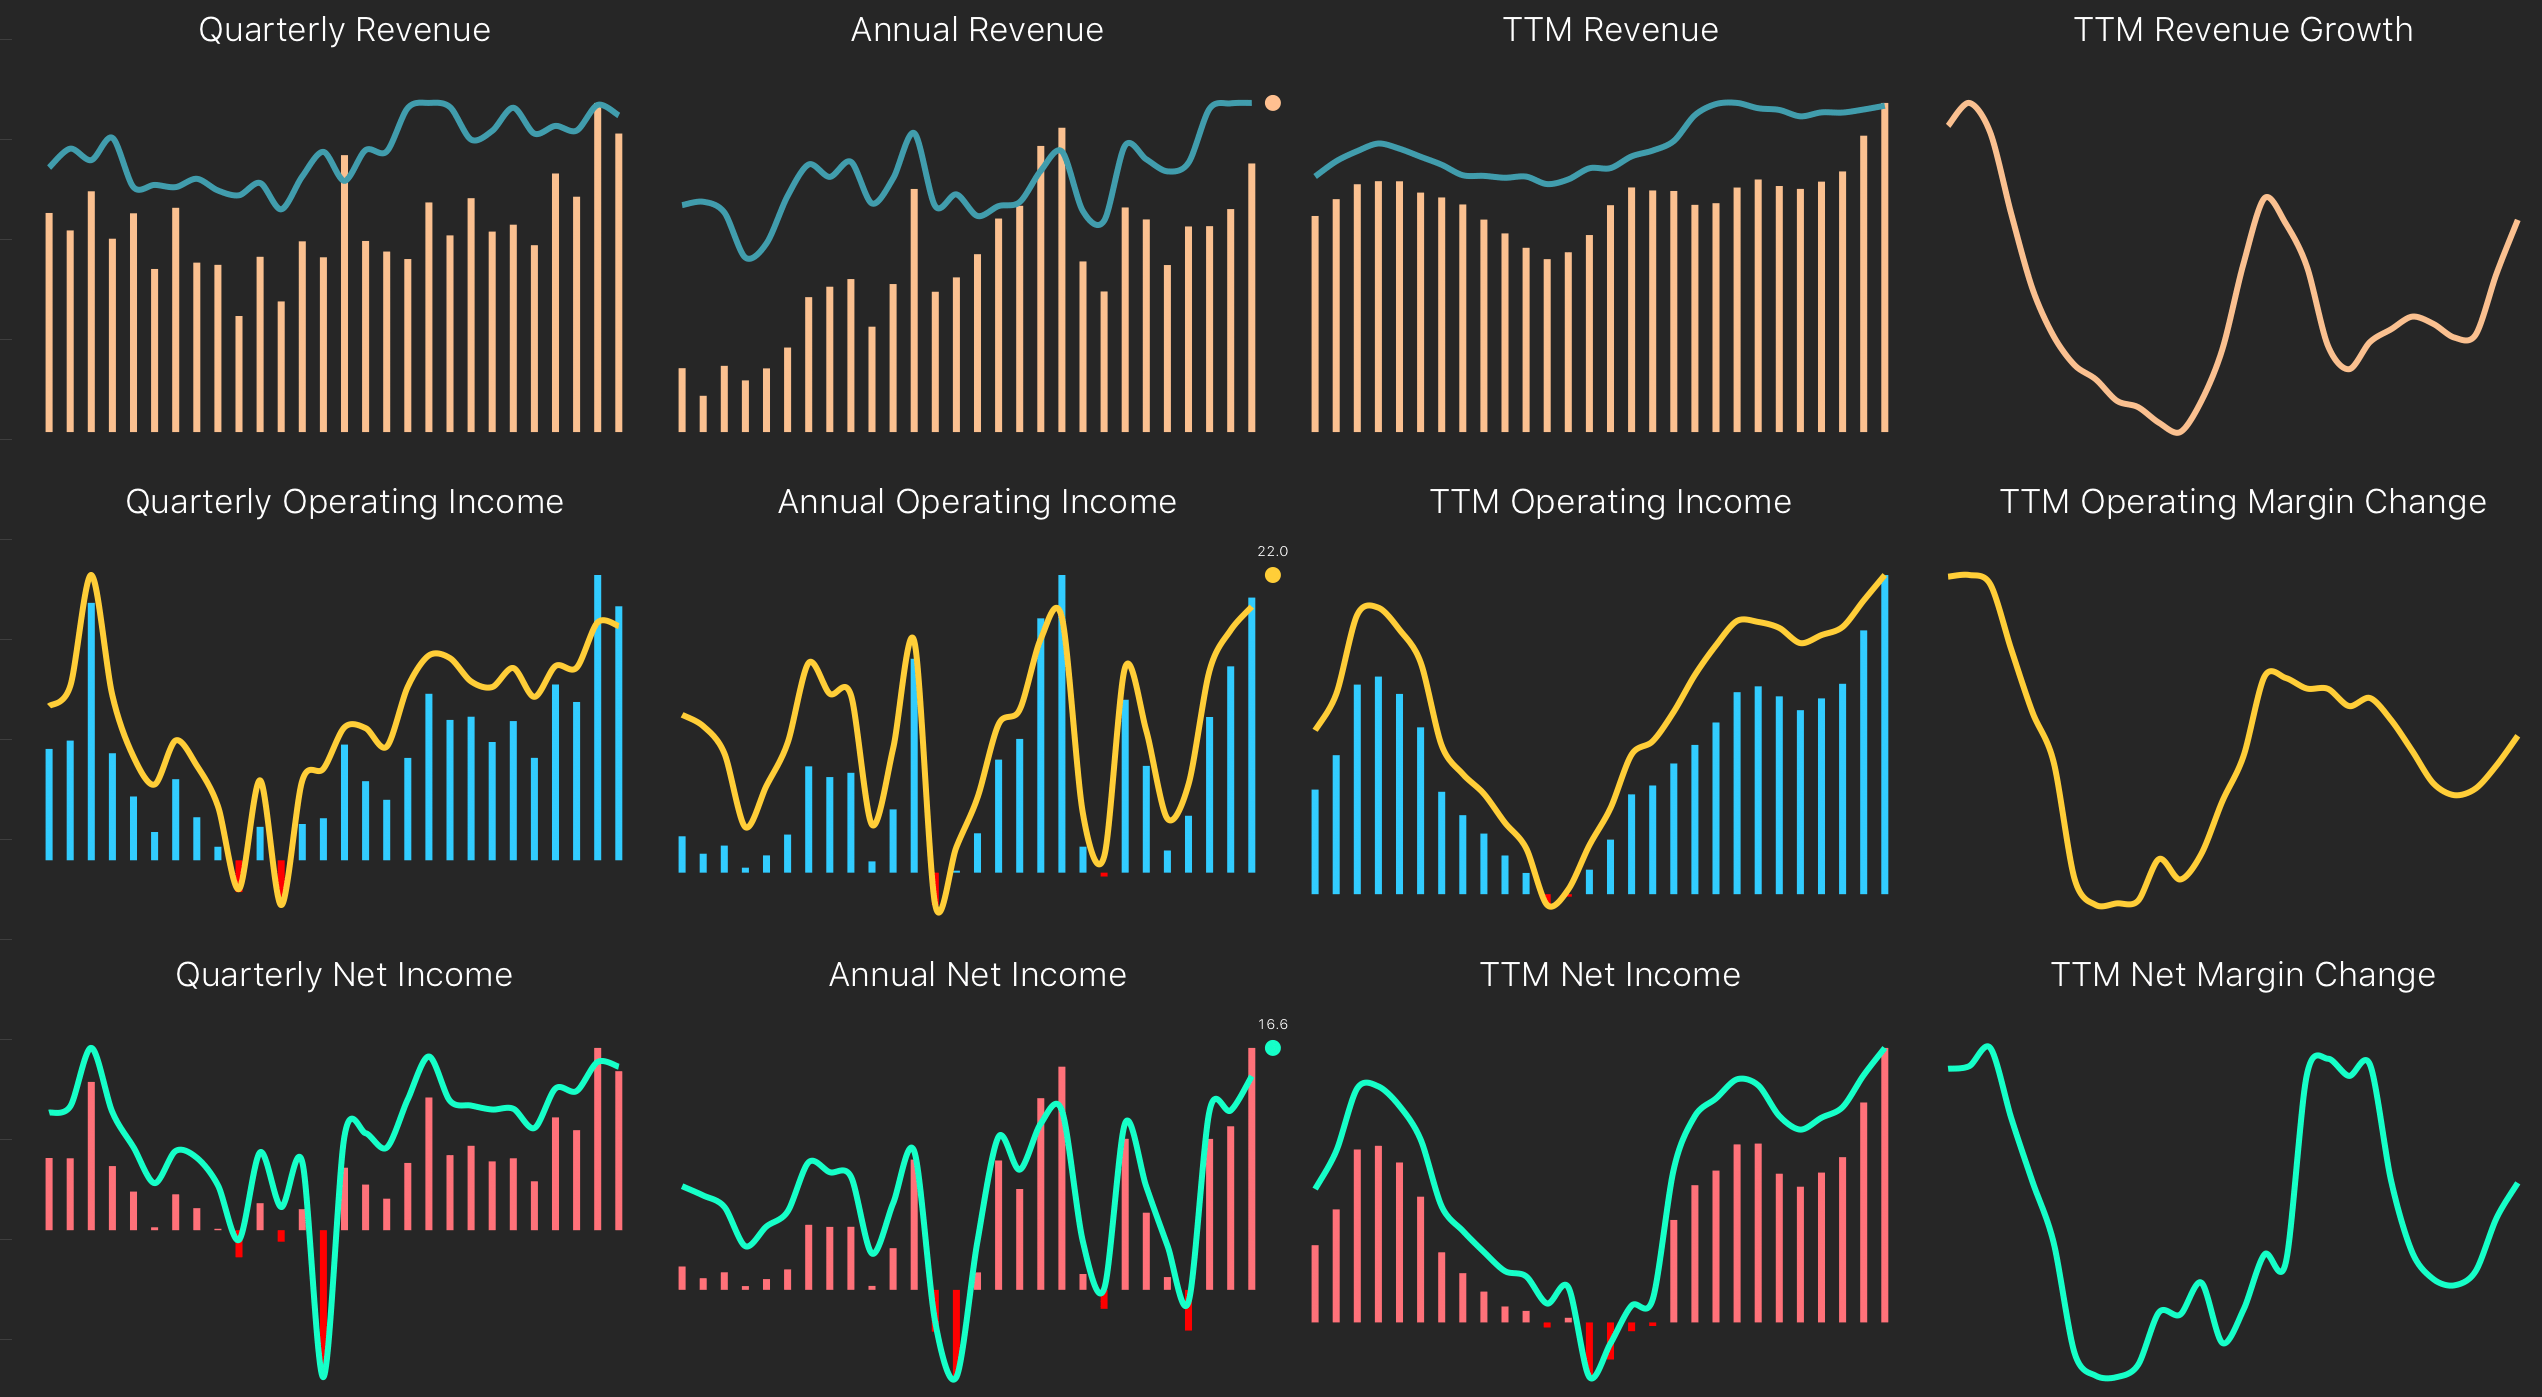
The Income Statement charts provide data on Revenue, Operating Income, Net Income, Gross Margin, Operating Margin and Net Margin for up to 28 years, 28 quarters and 28 periods of trailing twelve months (“TTM”).
Quarterly data have been adjusted to show discrete three-month periods. Where quarterly adjustment is not possible due to changes in fiscal year ends or due to changes between parent and consolidated accounting, the relevant periods are not shown.
Growth in Revenue and changes in Operating Margin and Net Margin are also presented in rolling twelve-month periods.
Annual Operating Income
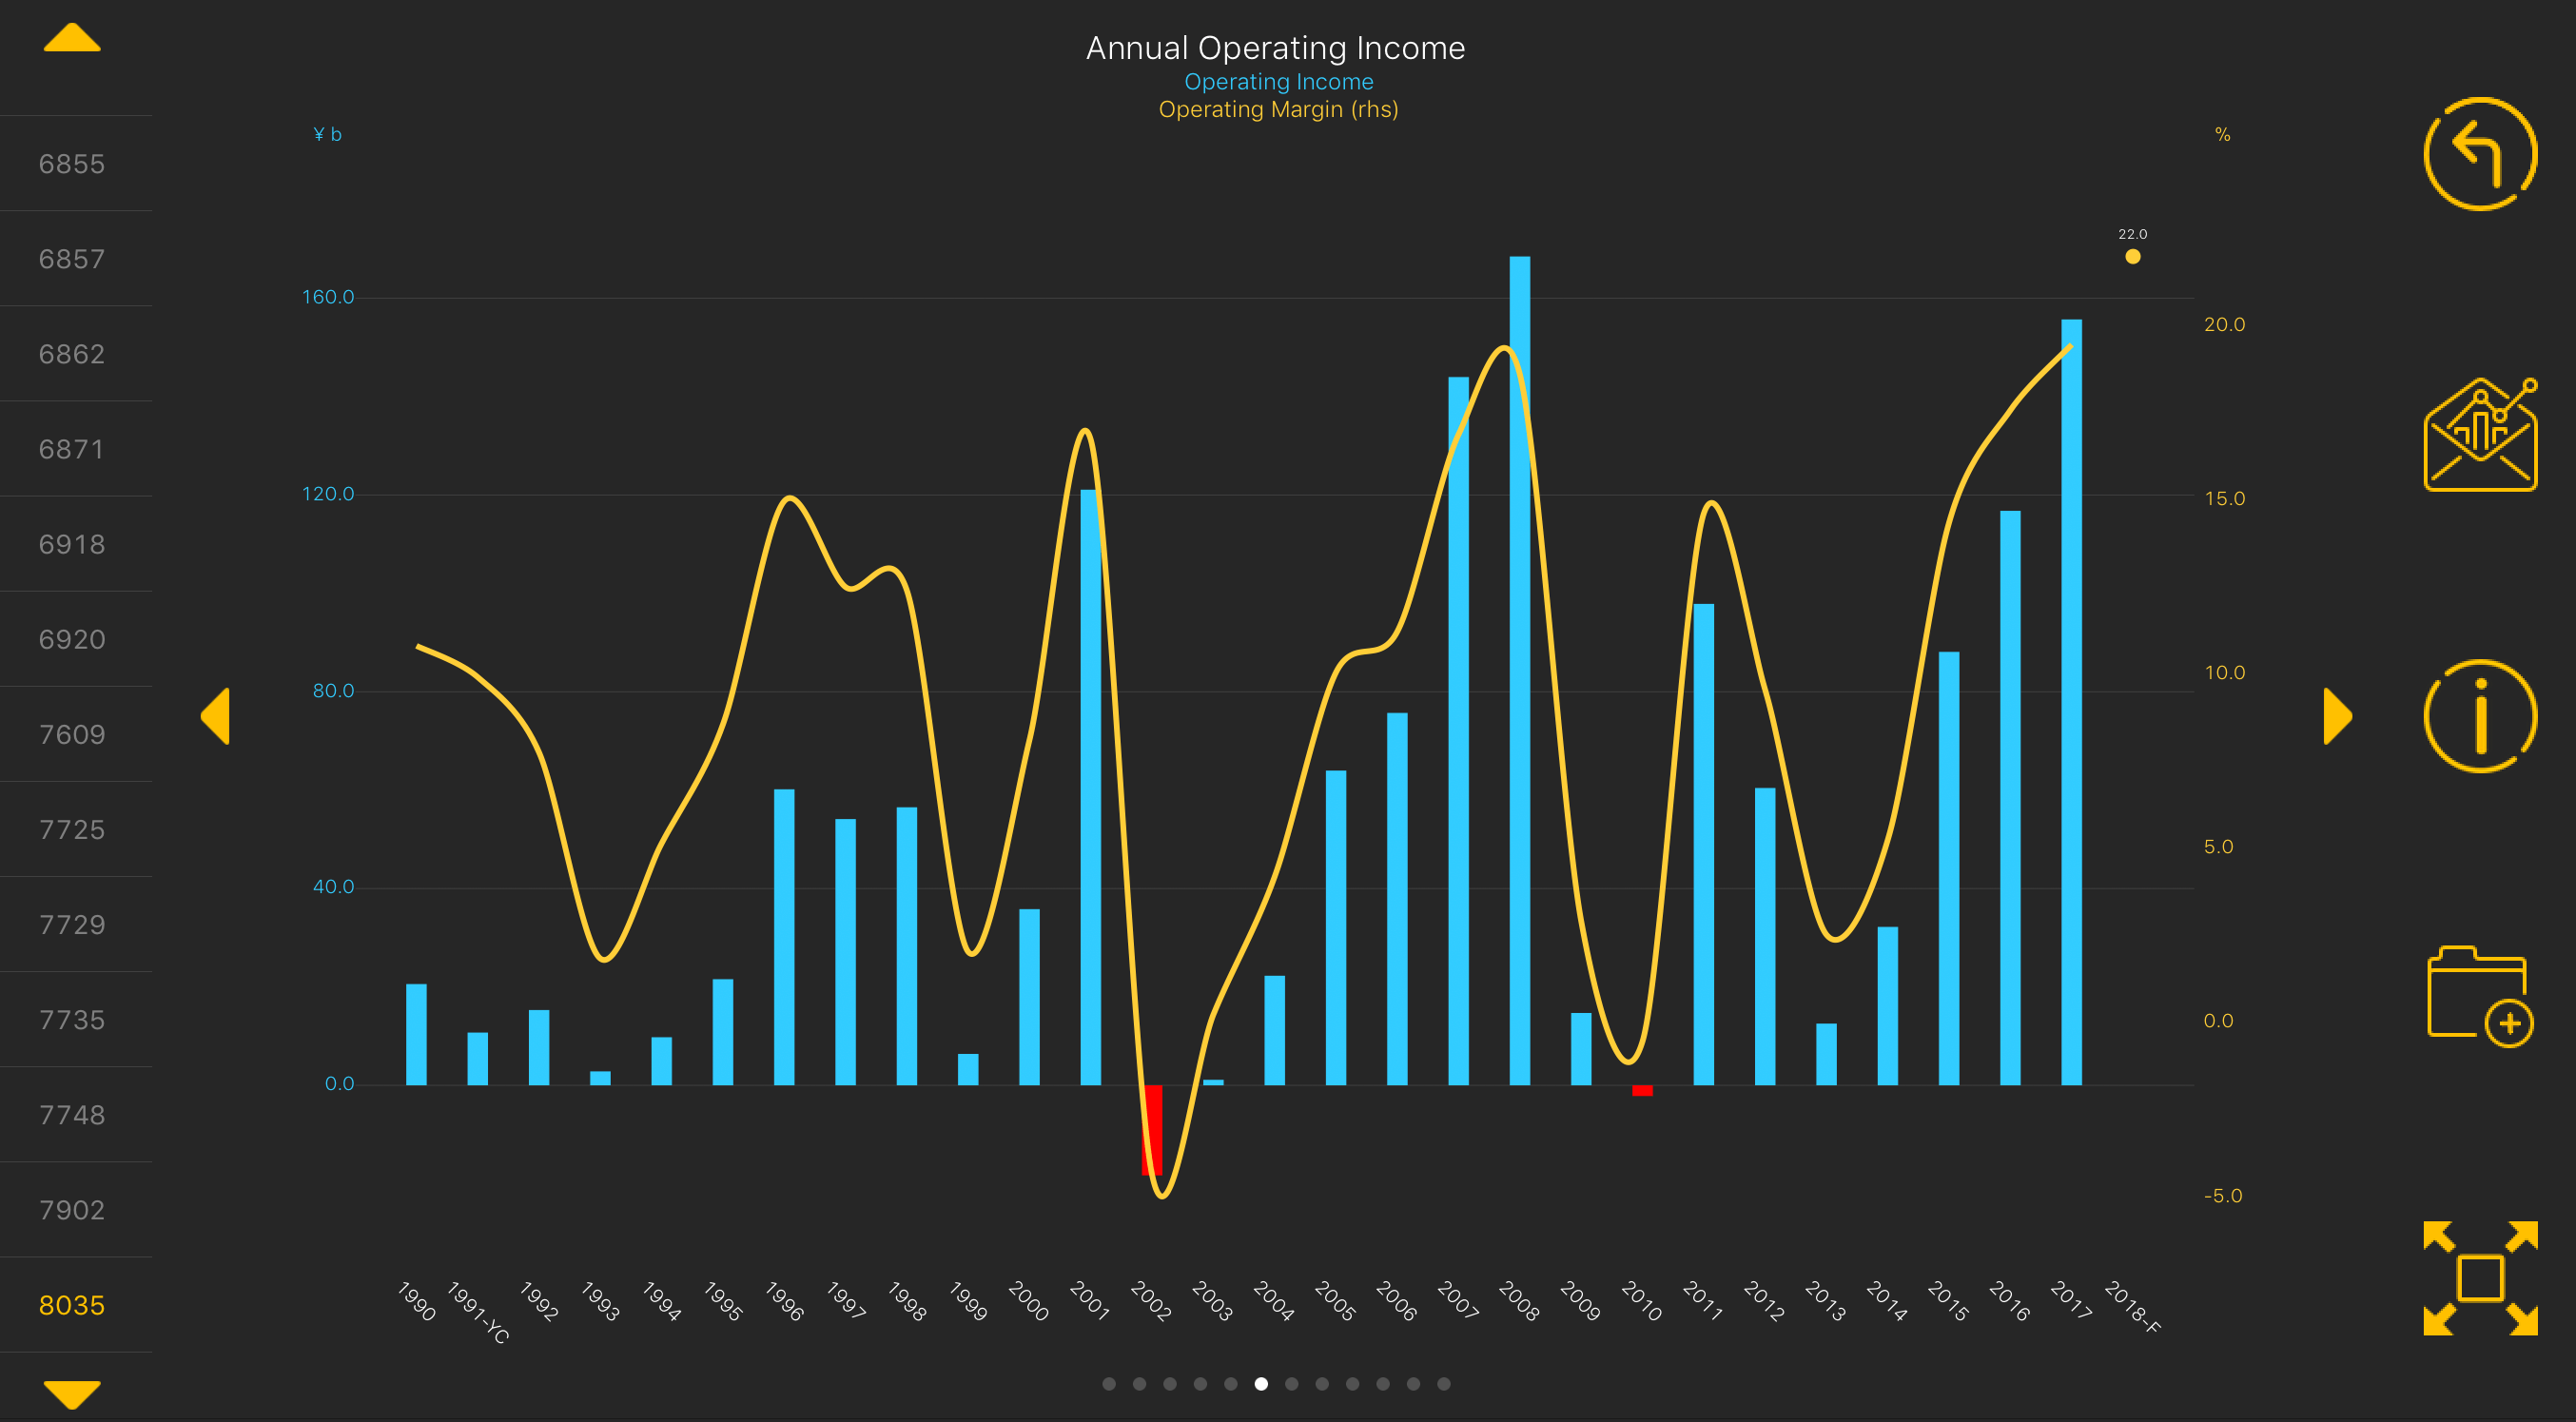
As an example of a 'single-chart view' the 'Annual Operating Income' chart shows Operating Income and Operating Margin over the most recent 28 years. Charts can be exported for non-commercial use using the 'Mail' icon or zoomed using the 'Zoom' icon. The 'Info' icon provides detailed definitions on the charts in the sub-module and the 'Portfolio' icon adds the current stock to the Portfolio Module.
In the horizontal date axis, Parent-only annual periods are flagged “-P” and periods where the accounts have been prepared in accordance with International Financial Reporting Standards are flagged “-IFRS”. Years during which the company changed its fiscal year end are flagged “-YC”.
If the company has made forecasts for Revenue, Operating Income or Net Income for the current fiscal year, the Revenue Forecast and the forecast Operating and Net Margins appear as a dot and the period is flagged “-F”.
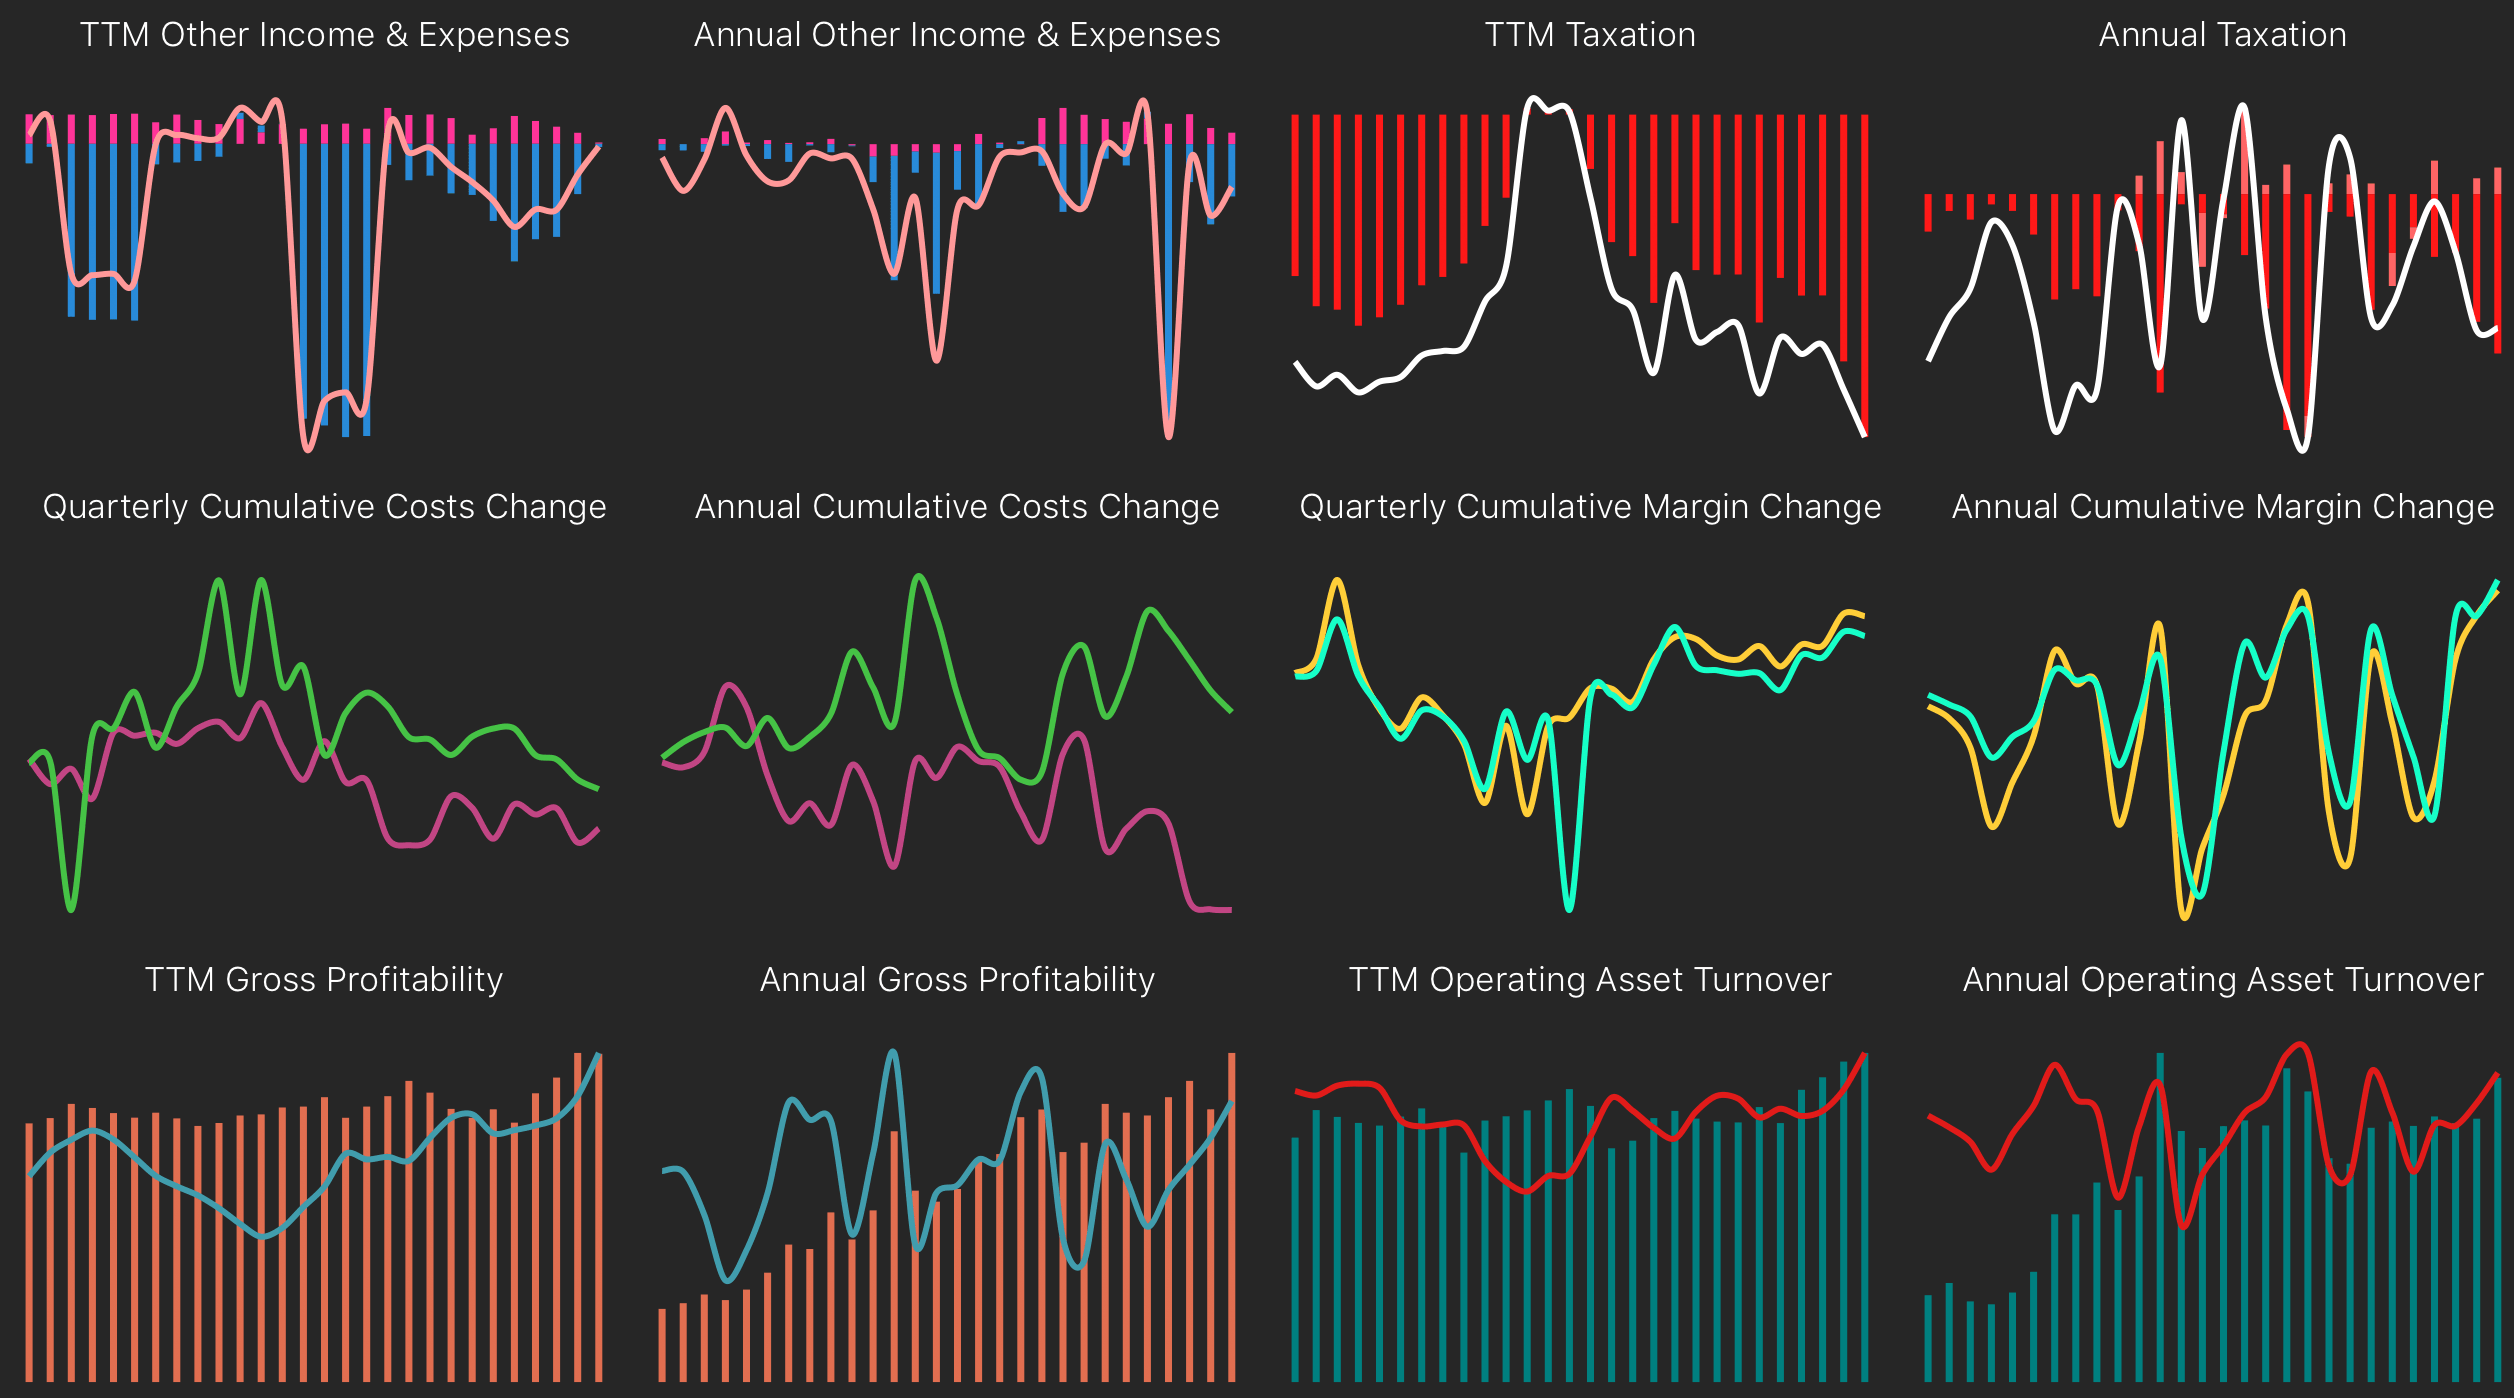
The Income Statement Analysis charts provide analysis of Other Income and Expenses, Taxation, margin evolution, the relationships between Gross Profits and Total Assets and the relationship between Revenue and Operating Assets.
Gross Profitability and Operating Asset Turnover are shown for both Annual and trailing twelve-month periods. Annual changes are adjusted to reflect any change in the company's fiscal year-end by annualizing the fiscal year.
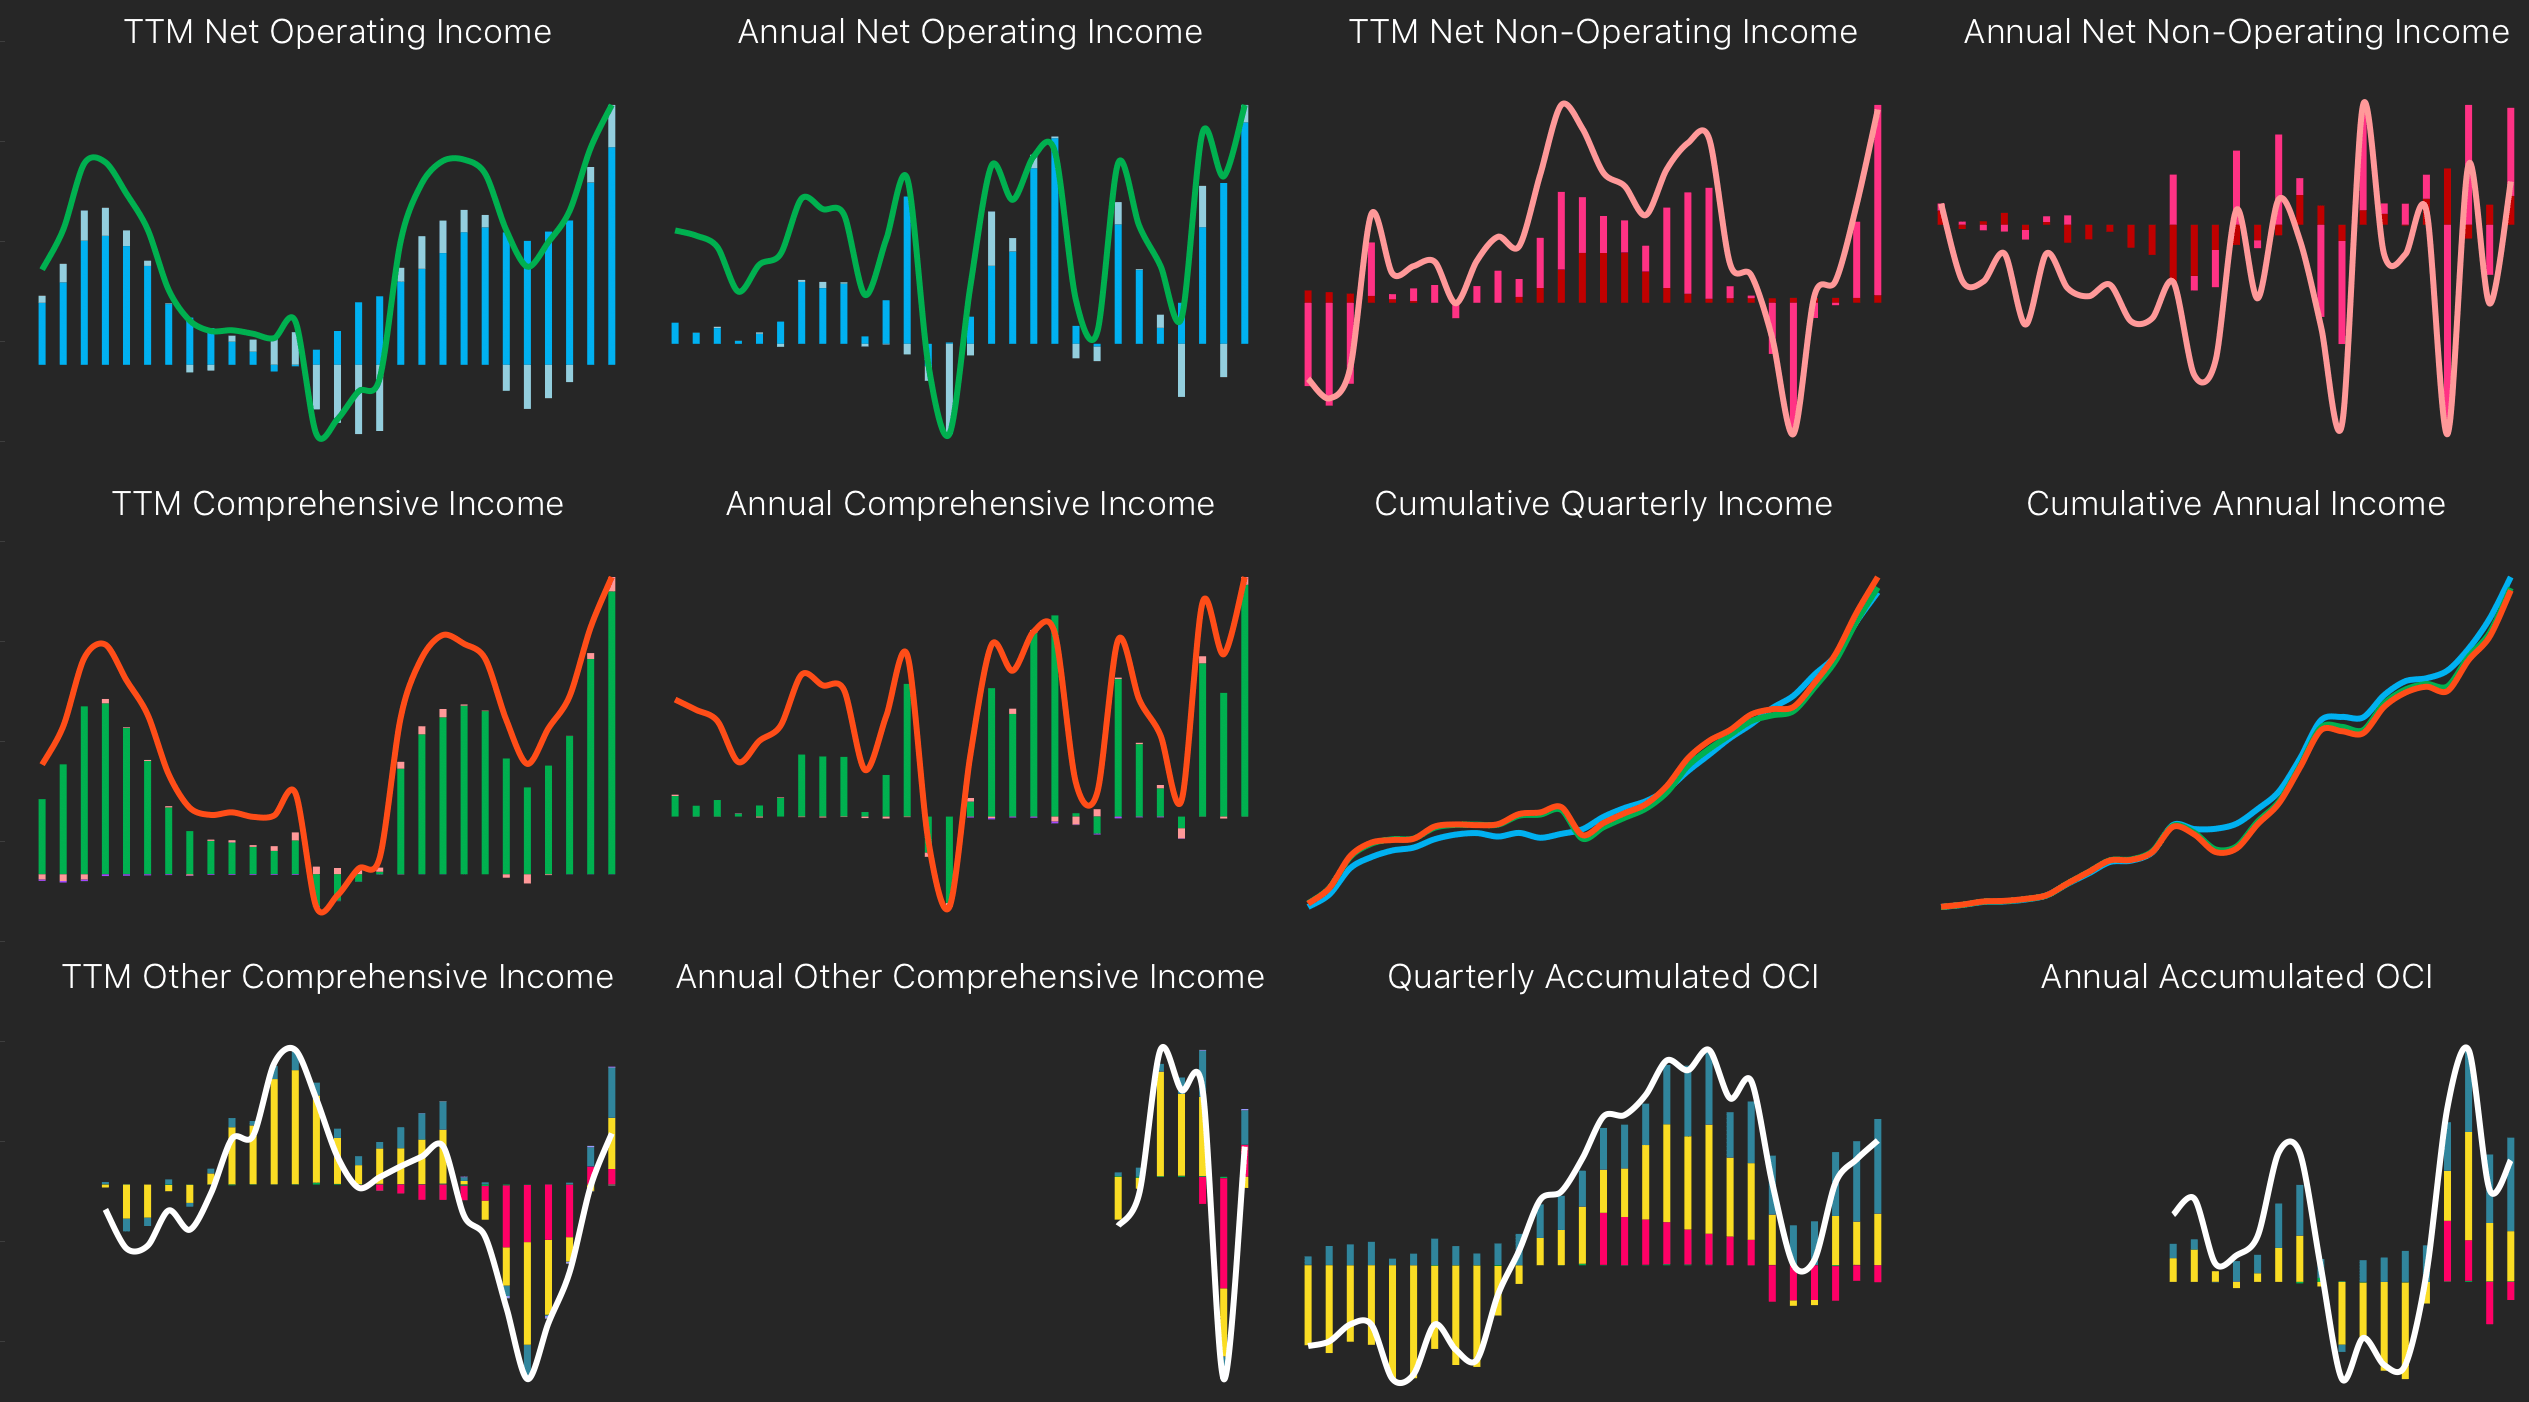
In order to provide a better understanding of a company’s business performance, the Income Statements have been reformulated and include all items from the Statement of Comprehensive Income and separate operating activities from financing and other non-operating activities.
In addition, a distinction is made between ‘Core’ operating activities that are more sustainable and to which a valuation multiplier can be applied and ‘Other’ operating activities such as currency gains and losses which are more transitory. A proportion of the total tax paid during the period has been allocated to each of the four resulting income components Core Operating Income, Other Operating Income, Financing and Other Non-Operating Income which are all presented net of tax.
Comprehensive Income is the change in Net Assets that is recognized for a period other than changes resulting from direct transactions with shareholders (including minority shareholders in subsidiaries) and warrant holders. Other Comprehensive Income is the portion of Comprehensive Income that is not included in Net Income or in Minority Interest's share of Net Income. A full reconciliation of Comprehensive Income allows for a clean articulation between the changes in the opening and closing Balance Sheets and reported Net Income.
Other Comprehensive Income is income recognized on the Balance Sheet but not included in Net Income. In this analysis, other Comprehensive Income items from the Statement of Comprehensive Income are allocated to the relevant income components other than Core Operating Income. The ‘bottom-line’ number in the reformulated Income Statement is ‘Comprehensive Income to Common Equity which is the sum of Net Operating and Non-Operating Income after accounting for Minorities.
Other Comprehensive Income items have been disclosed in the Statement of Changes in Equity from May 2006 (although marketable securities gains and losses and foreign currency translation adjustments have been presented as part of net assets from April 2001 and 2000, respectively). From April 2011, JGAAP has also required these items to be presented in the Income Statement in addition to Net Income. The amounts are reported net of taxation. For the purposes of this analysis and in accordance with IFRS Accounting Standards, the accumulated amount of Other Comprehensive Income is treated as part of Shareholder's Equity on the Balance Sheet, although this is not the current practice under JGAAP. In periods prior to the disclosure of separate Statements of Comprehensive Income, changes in Accumulated Comprehensive Income on the Balance Sheet are reflected in the appropriate income component.
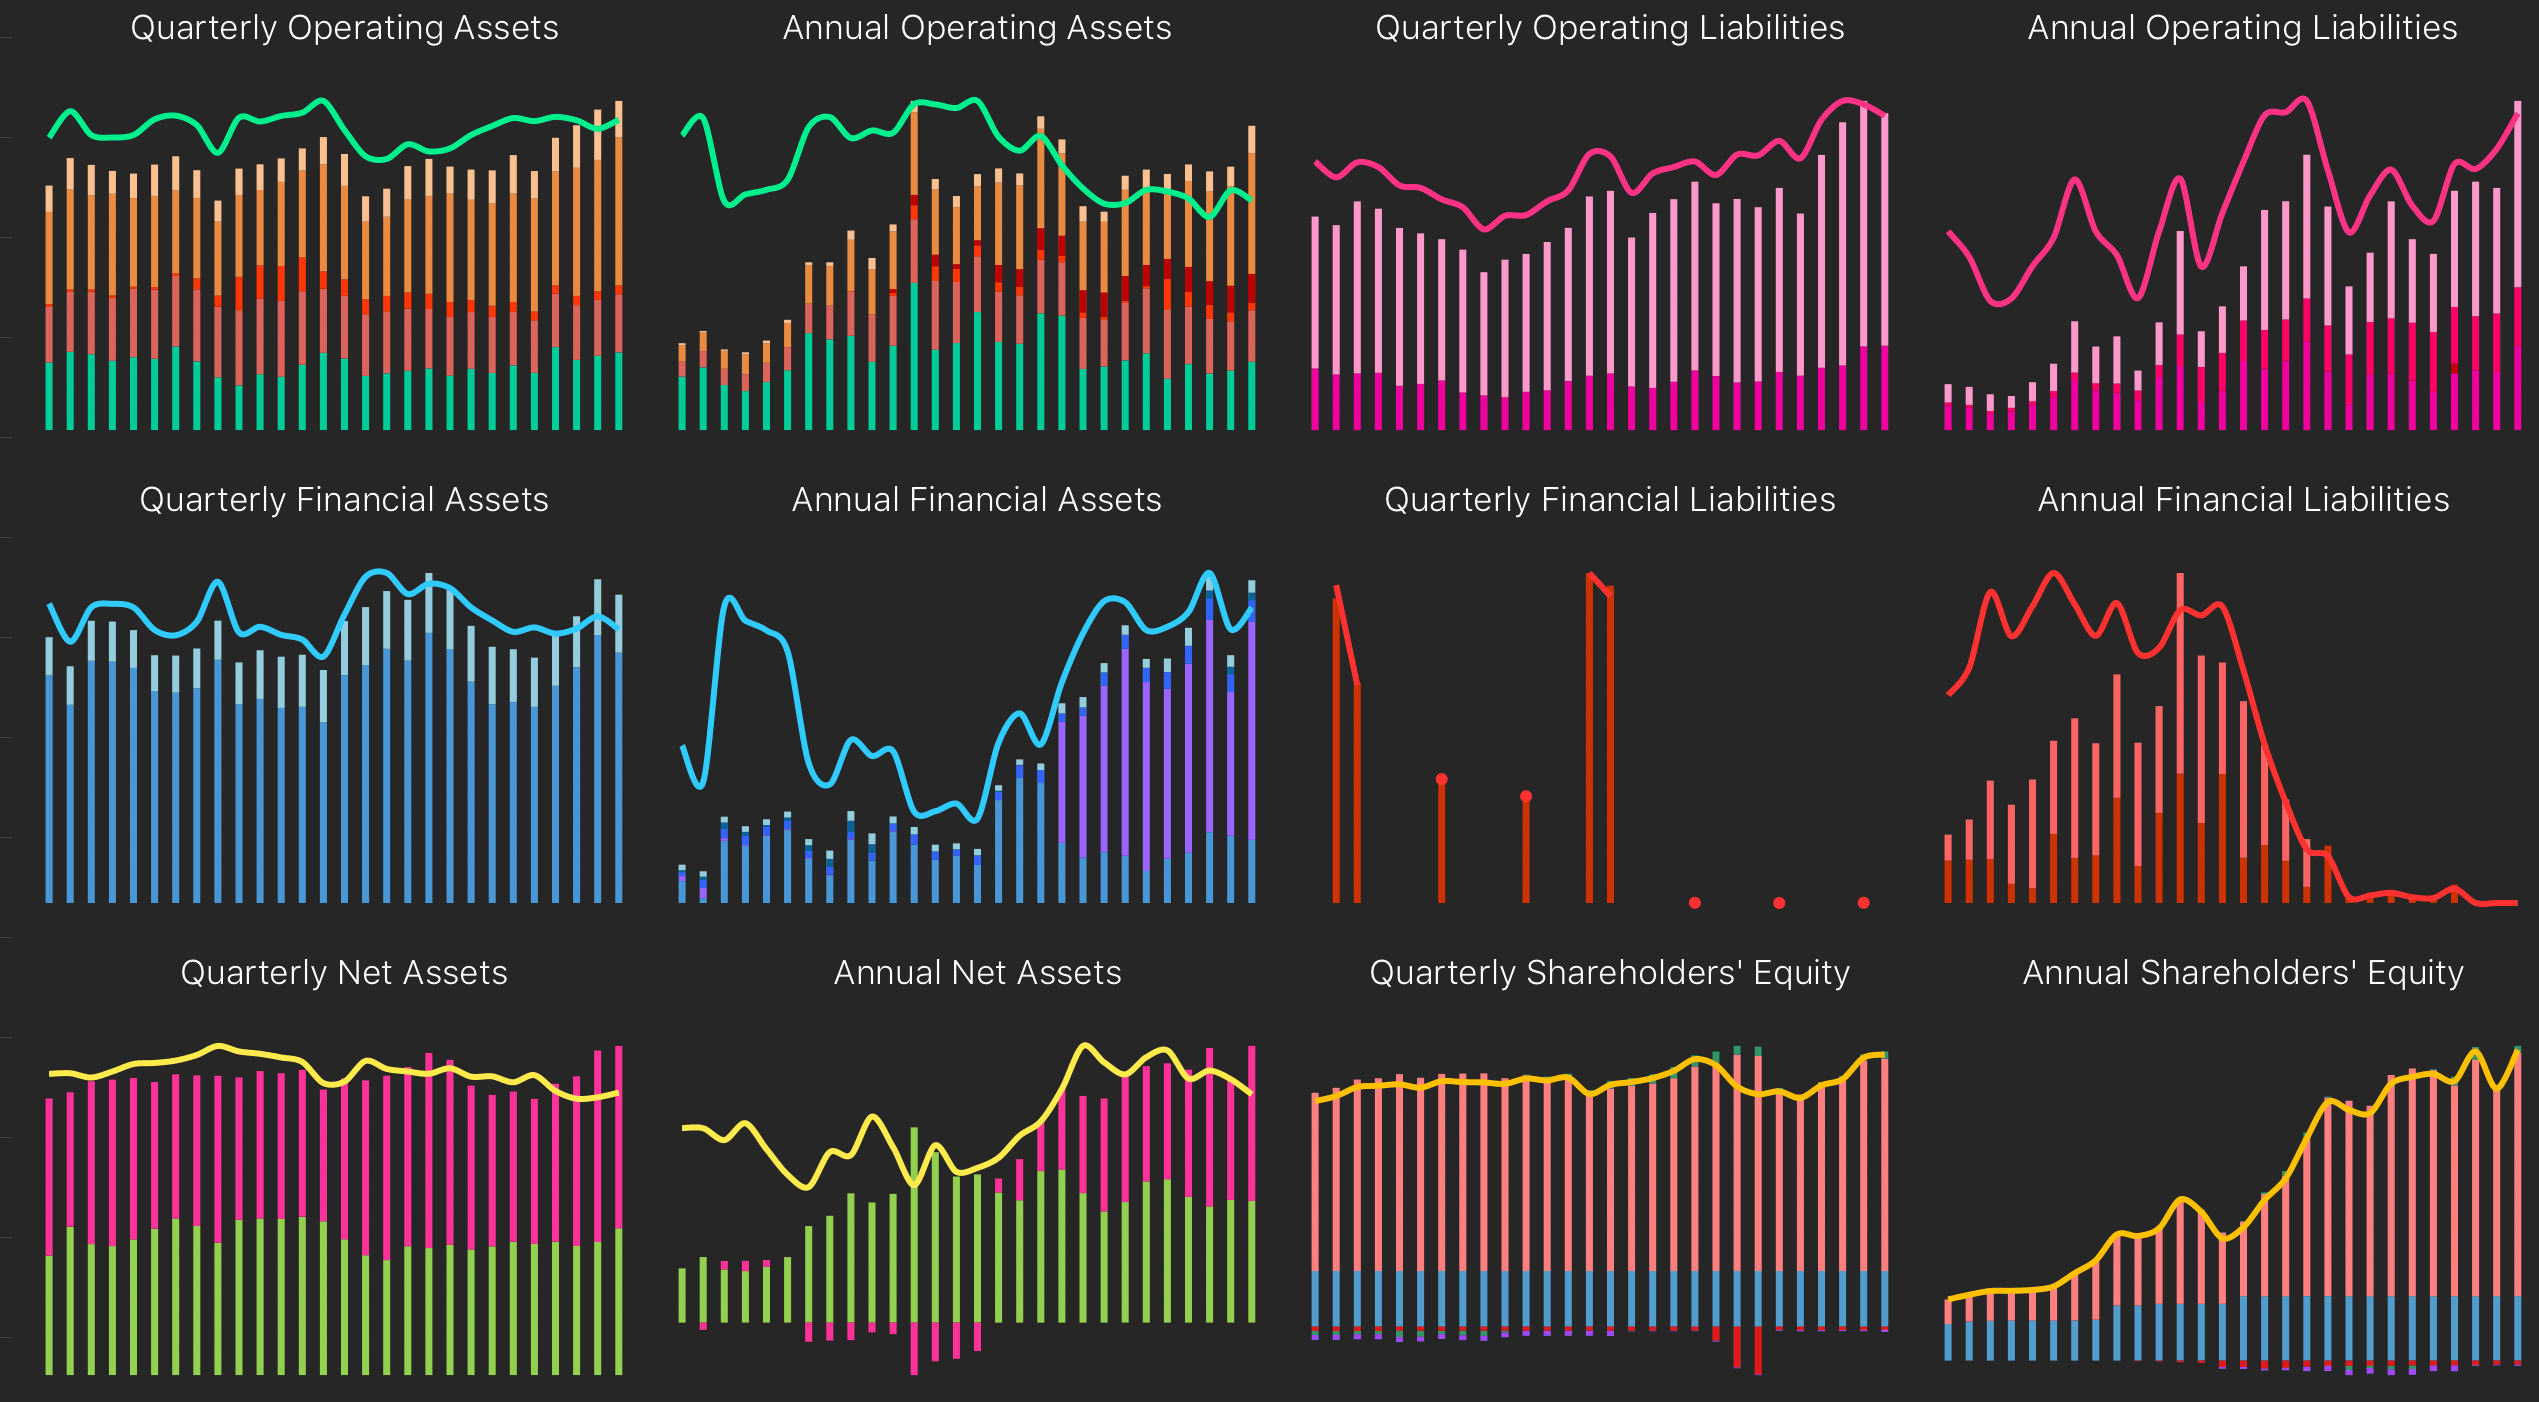
Generally accepted accounting principles require that balance sheets are categorized by time with a distinction between Current and Non-Current Assets and Liabilities. This analysis adopts an alternative presentation for non-financial companies by separating operating activities from financing activities. Operating activities are primarily trading with customers and suppliers in goods and services but also include investments in inventories and fixed assets. Financial activities include the raising of cash from and returning of cash to debt providers and equity holders and also the investment of any financial surpluses. The functional distinction is important as, in most cases, it is only the operating activities that add value to a business. For non-financial companies, almost all financial activities should be considered to have zero net present value.
The Annual and Quarterly Balance Sheets are reformulated into four categories, Operating Assets, Operating Liabilities, Financial Assets and Financial Liabilities. Operating Assets and Operating Liabilities sum to Net Operating Assets/Liabilities (NOA/L) and Financial Assets and Financial Liabilities sum to Net Financial Assets/Liabilities (NFA/L). NOA/L and NFA/L together equal Net Assets.
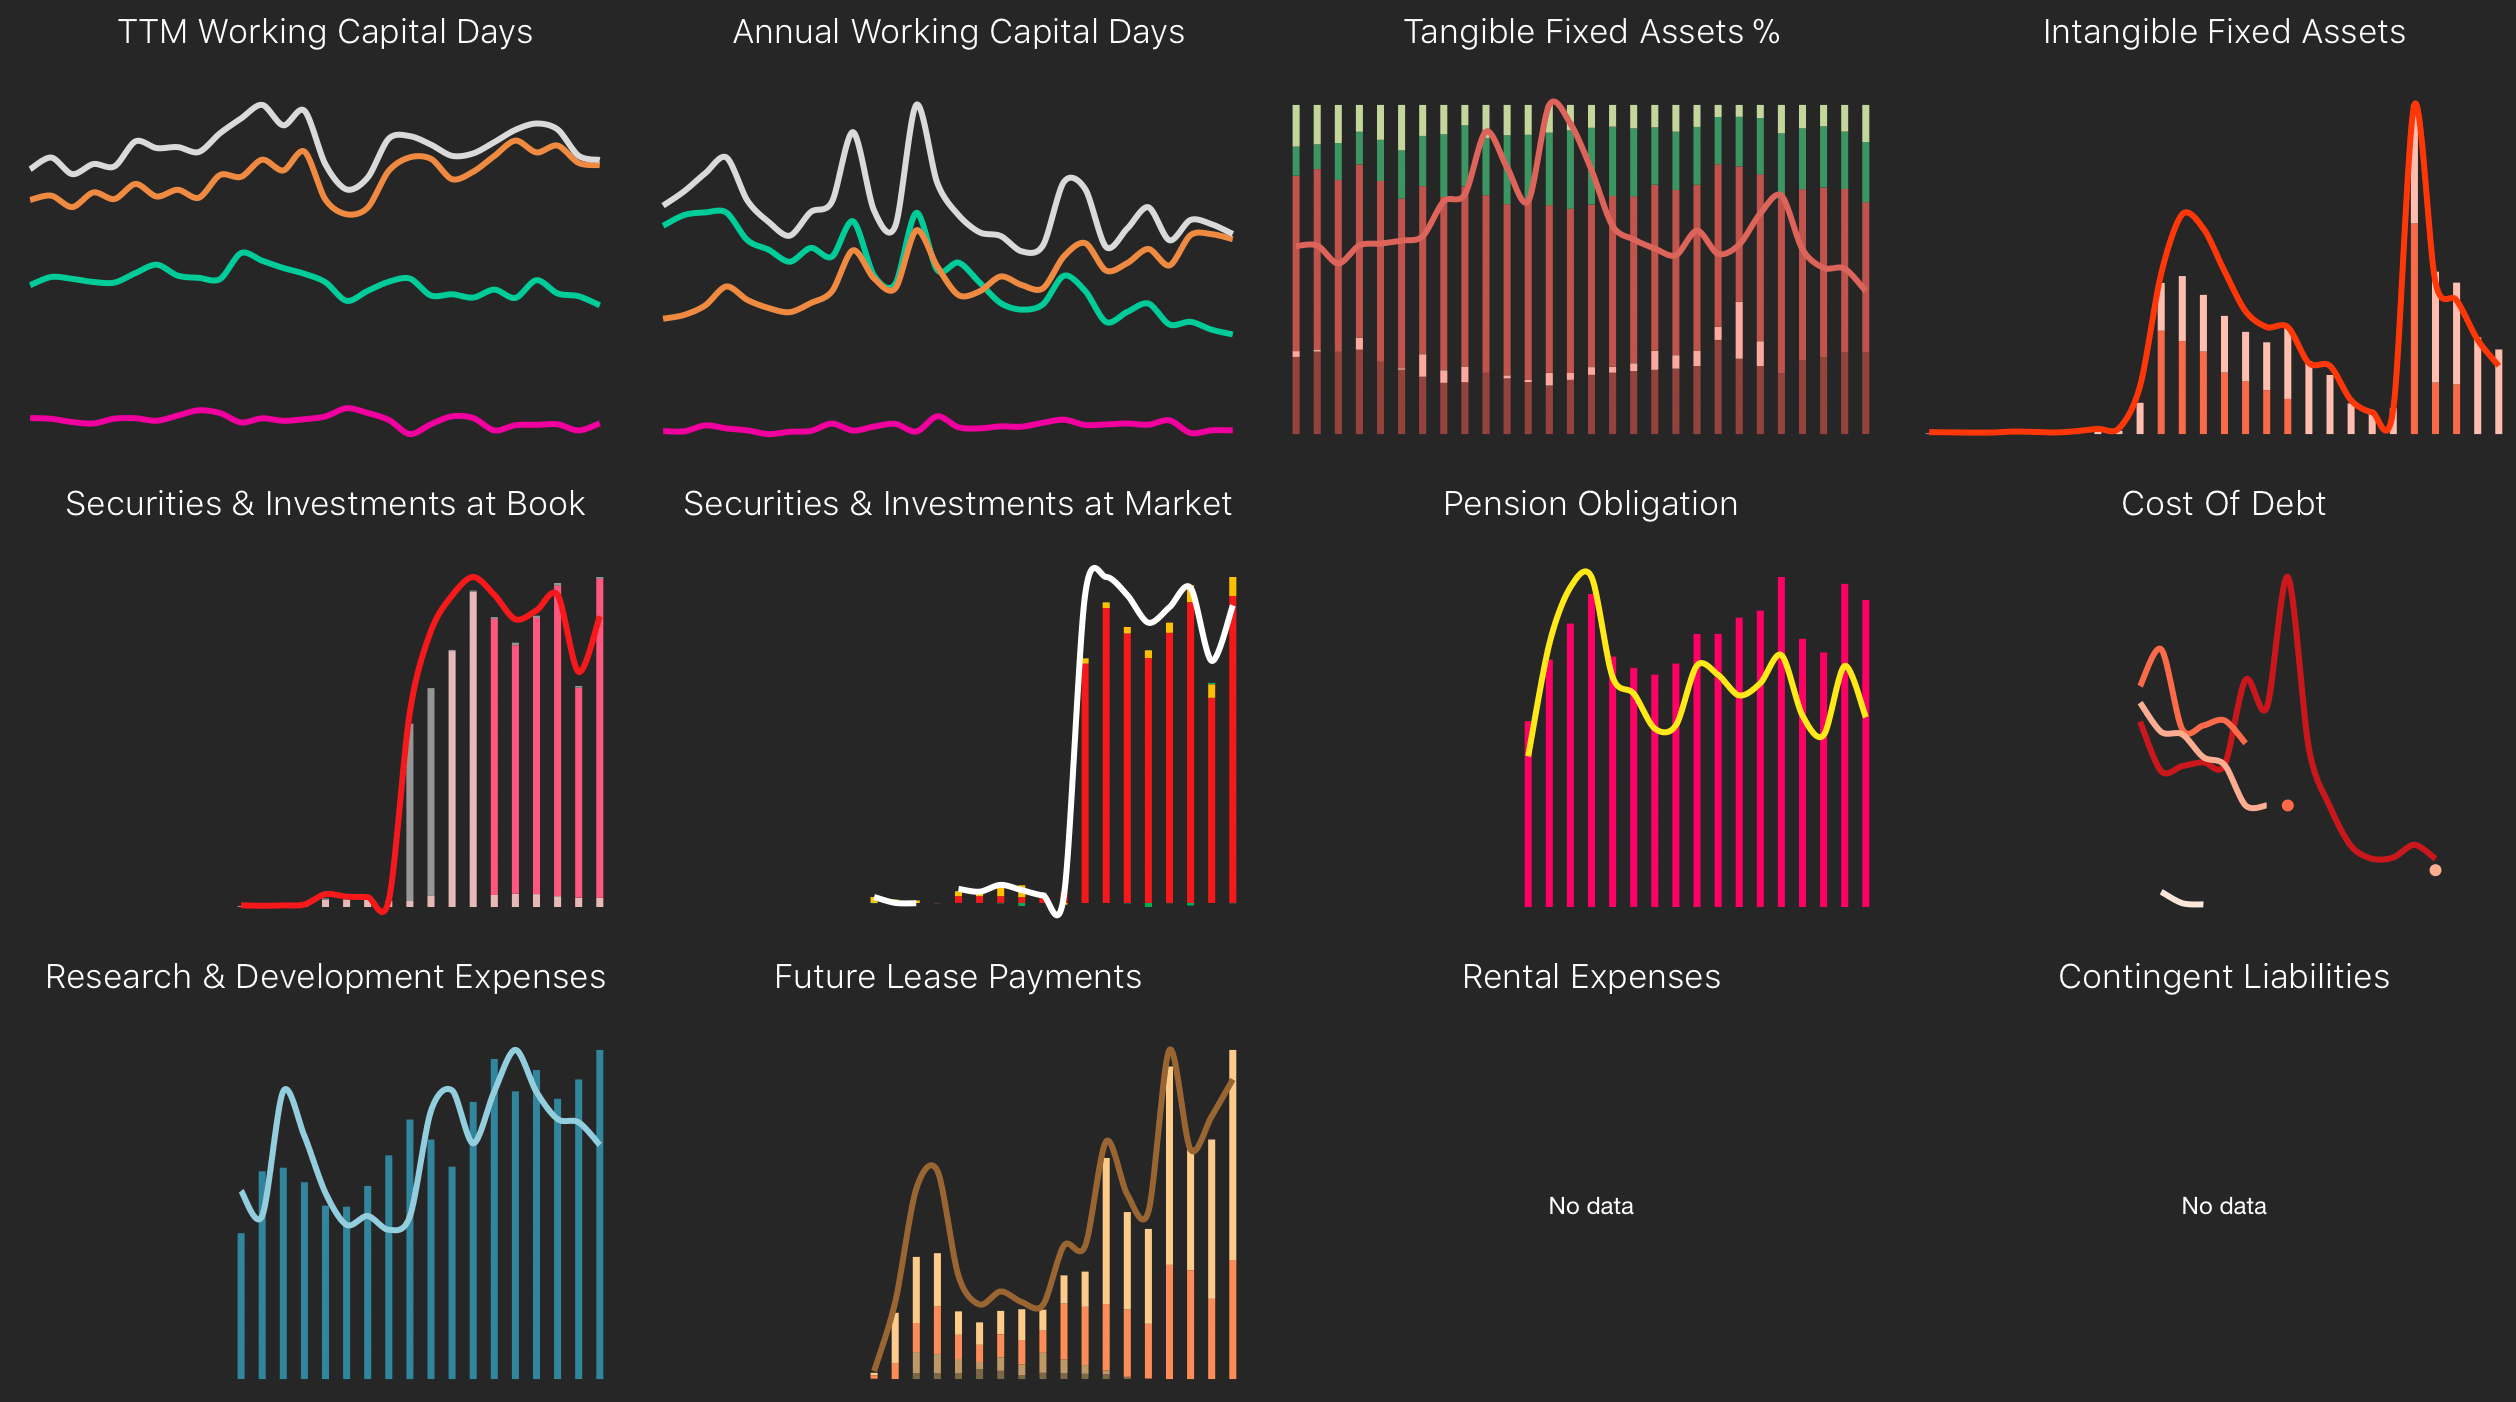
To supplement the balance sheet, quarterly and annual cash conversion cycle charts are provided calculated in terms of working capital days. Due to differences in disclosure between book value and cost, Tangible Fixed Assets can only be presented only as a percentage breakdown.
Securities and Investments are presented at both Book Cost and Market Value with the former being sub-divided into Trading Securities, Securities Available for Sale, Securities to be Held To Maturity and those with no market value and the latter sub-divided into Book Value, Unrealized Gains and Losses and Derivatives. Pensions Obligations/Over-funding and the Cost of Debt at various maturities are also shown.
No adjustments are made to the company's Balance Sheets or Income Statements in this analysis to correct for the current accounting treatment of Intangible Assets, Pension Obligations, Research & Development Expenses, Operating Leases, Rental Expenses and Contingent Liabilities. The relevant amounts are presented to allow for comparison and further analysis.
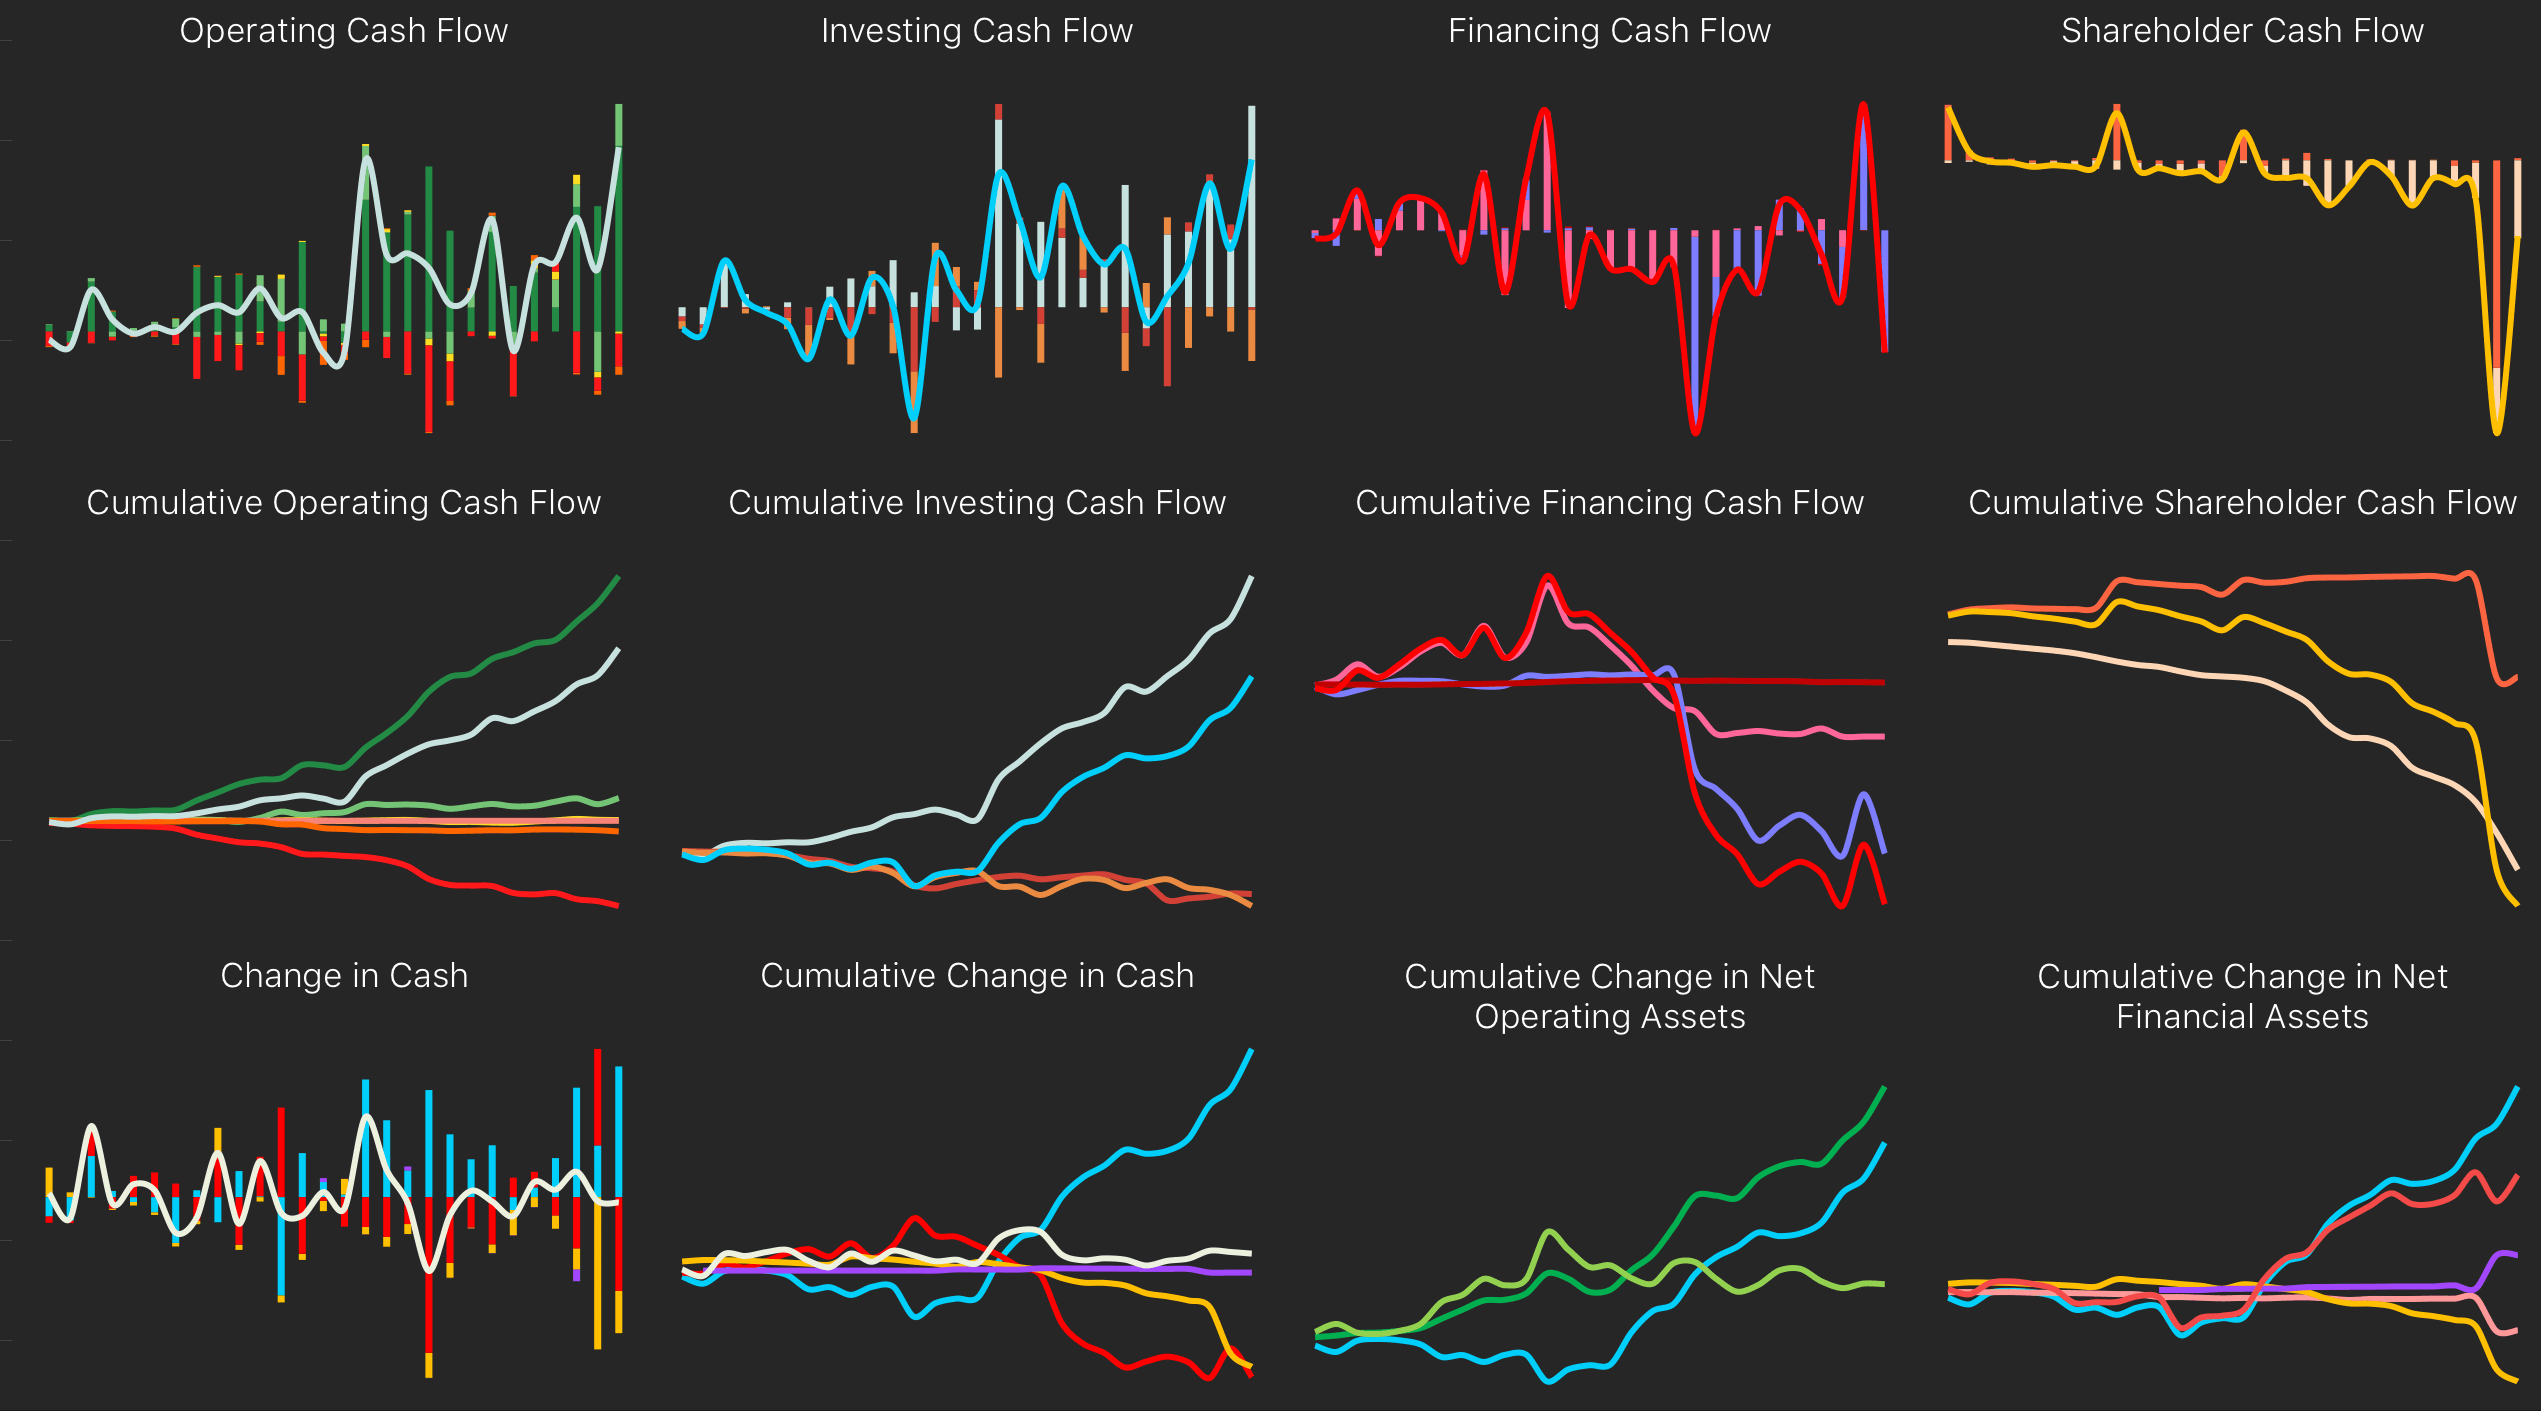
The Cash Flow statements (which are derived from the Income Statements and Balance Sheets) have been reformulated to reflect the same distinction between operating and financing activities as is applied to the Income Statements and Balance Sheets. Cash flow items relating to operating activities are divided into Operating Cash Flow and Investing Cash Flow while those relating to financing activities are divided into Financing Cash Flow and Shareholder Cash Flow.
The reformulated Balance Sheets, Income and Cash Flow Statements follow a clean-surplus relationship and are fully articulated with each other. The change in Net Operating Assets in each period is equal to Net Operating Income minus Free Cash Flow. The change in Net Financial Assets is equal to the sum of Free Cash Flow, Net Non-Operating Income, Shareholder Cash Flow and Minorities and Adjustments.
Cash flow items are presented for each period as well as cumulative totals.
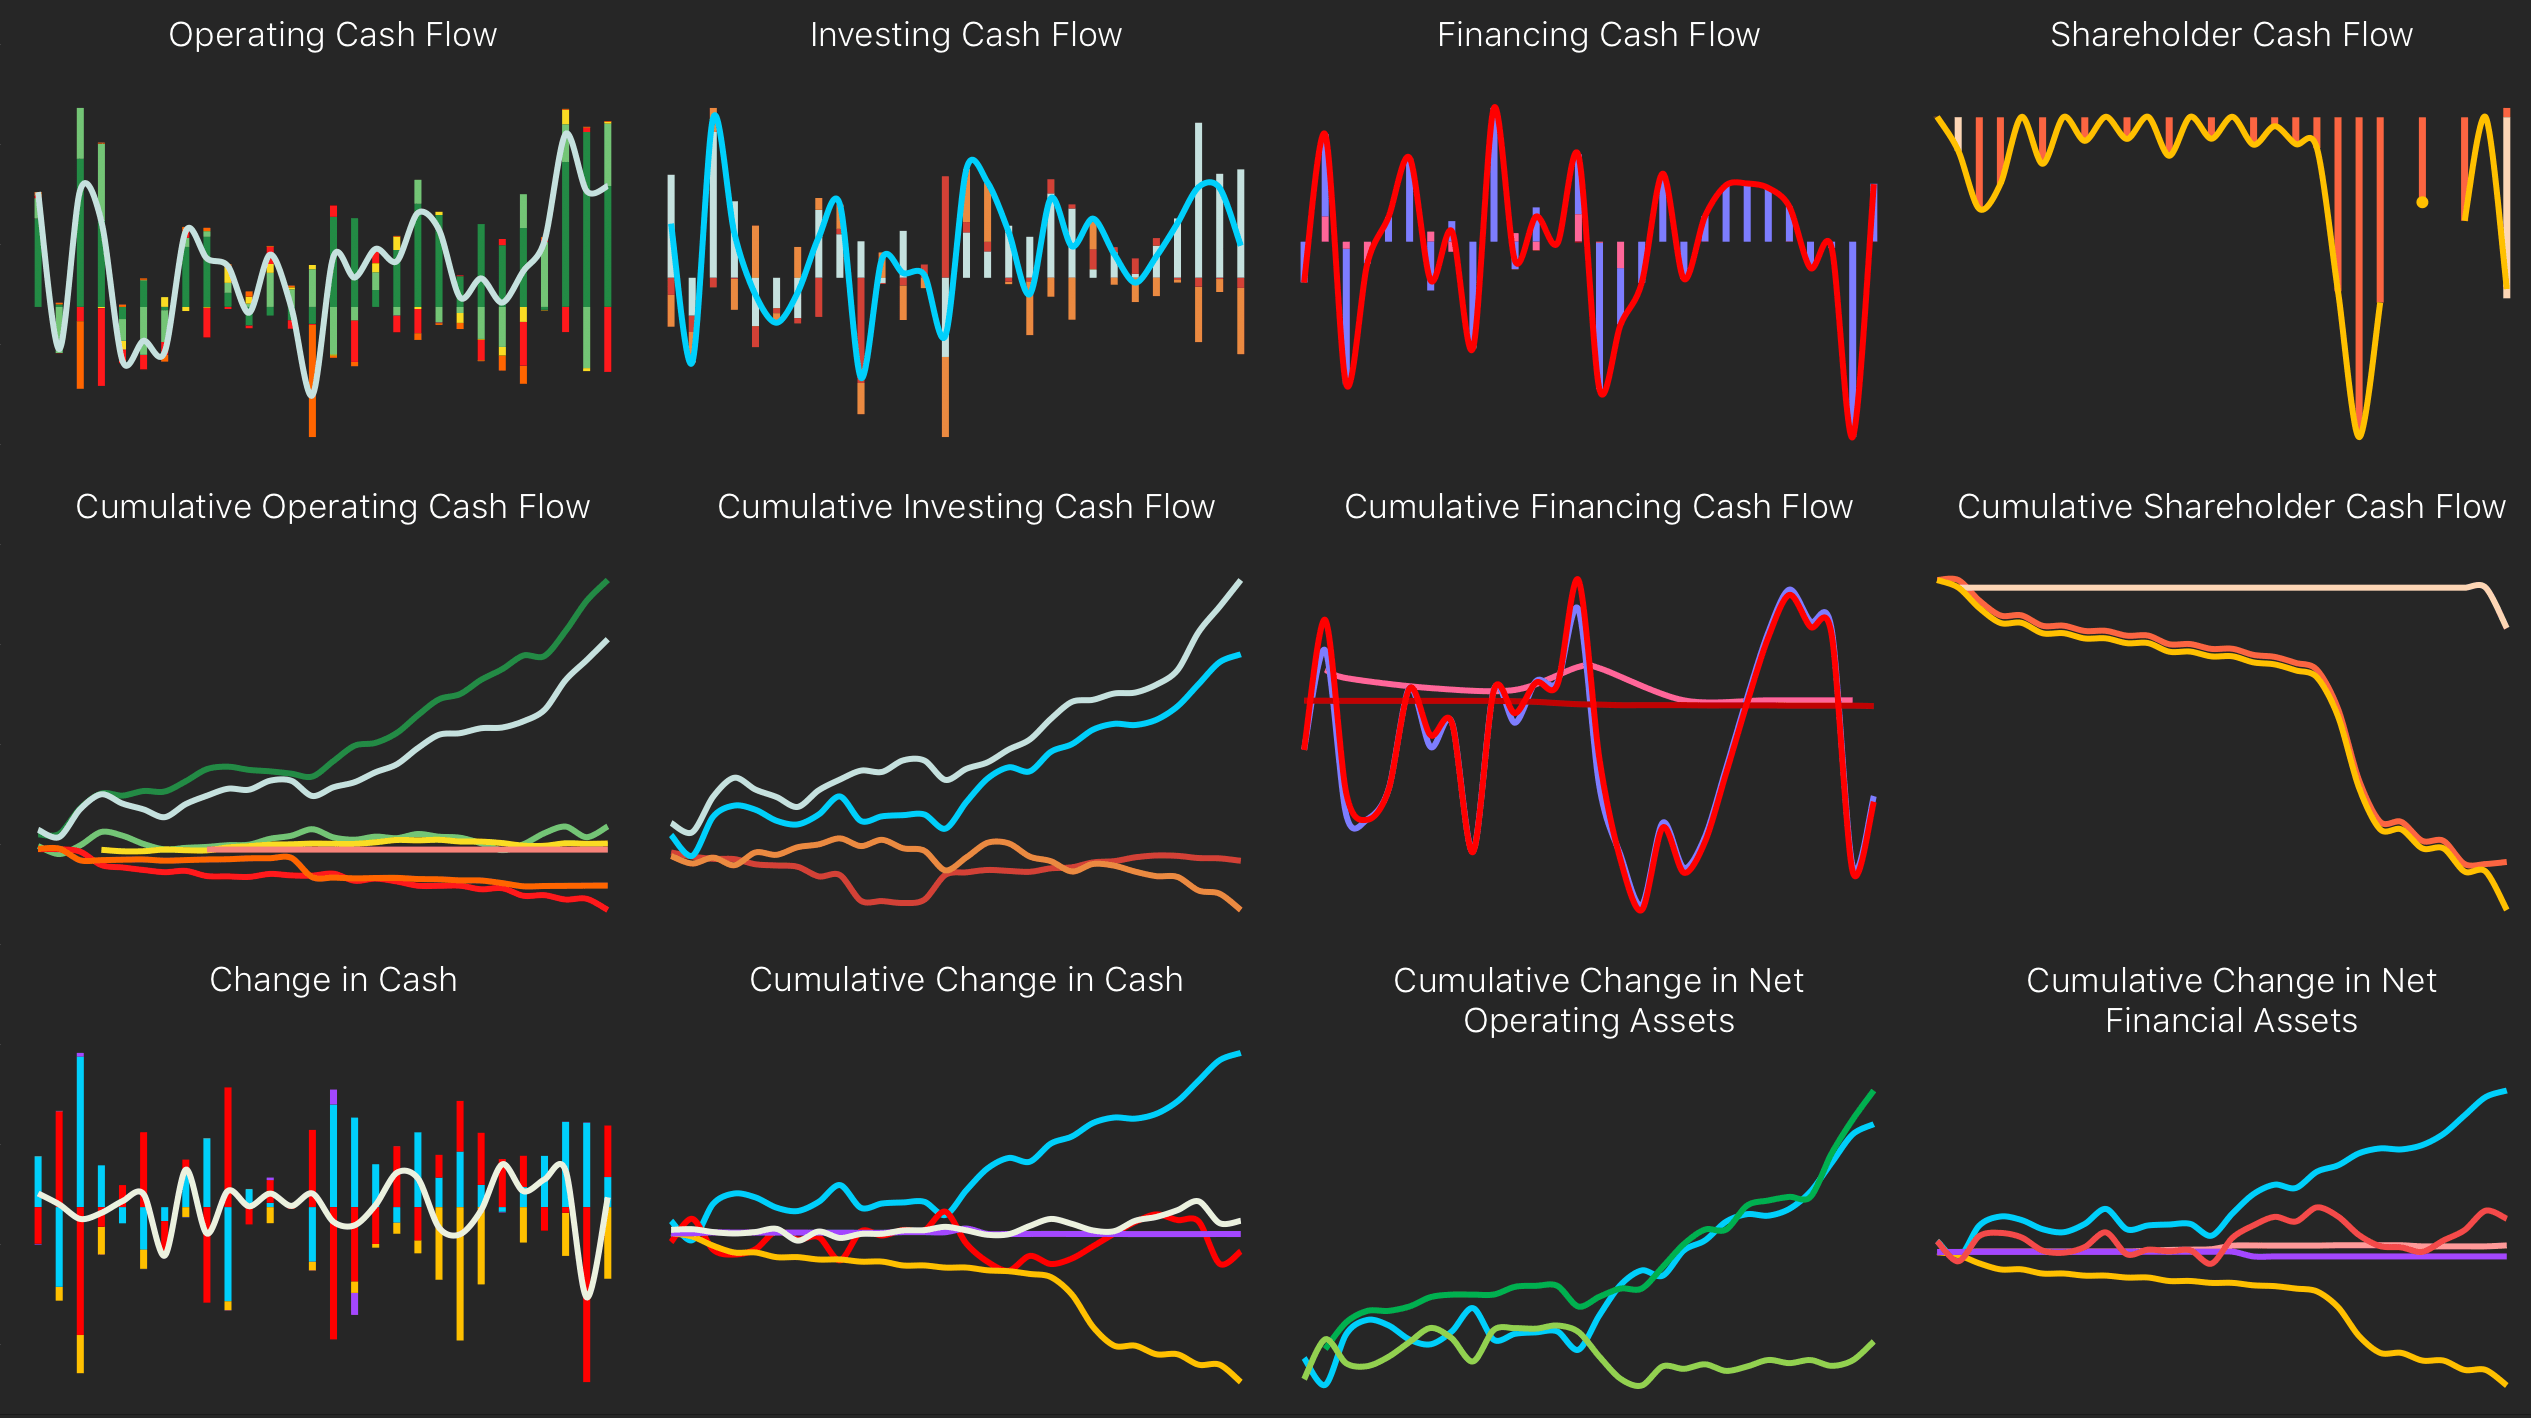
The quarterly Cash Flow analysis follows the same format as the annual. As the data is derived from the adjusted quarterly Income Statement and the quarterly Balance Sheet, the App is able to present cash flow information that is routinely omitted from the official filings.
All derived cash flow statements are subject to quality controls with a tolerance for a variation of an average of ¥2m per period per company. Period progressions are not impacted by changes in accounting standards, however, if a change in fiscal year end results in irregular reporting periods, then no data will be presented for the relevant periods.
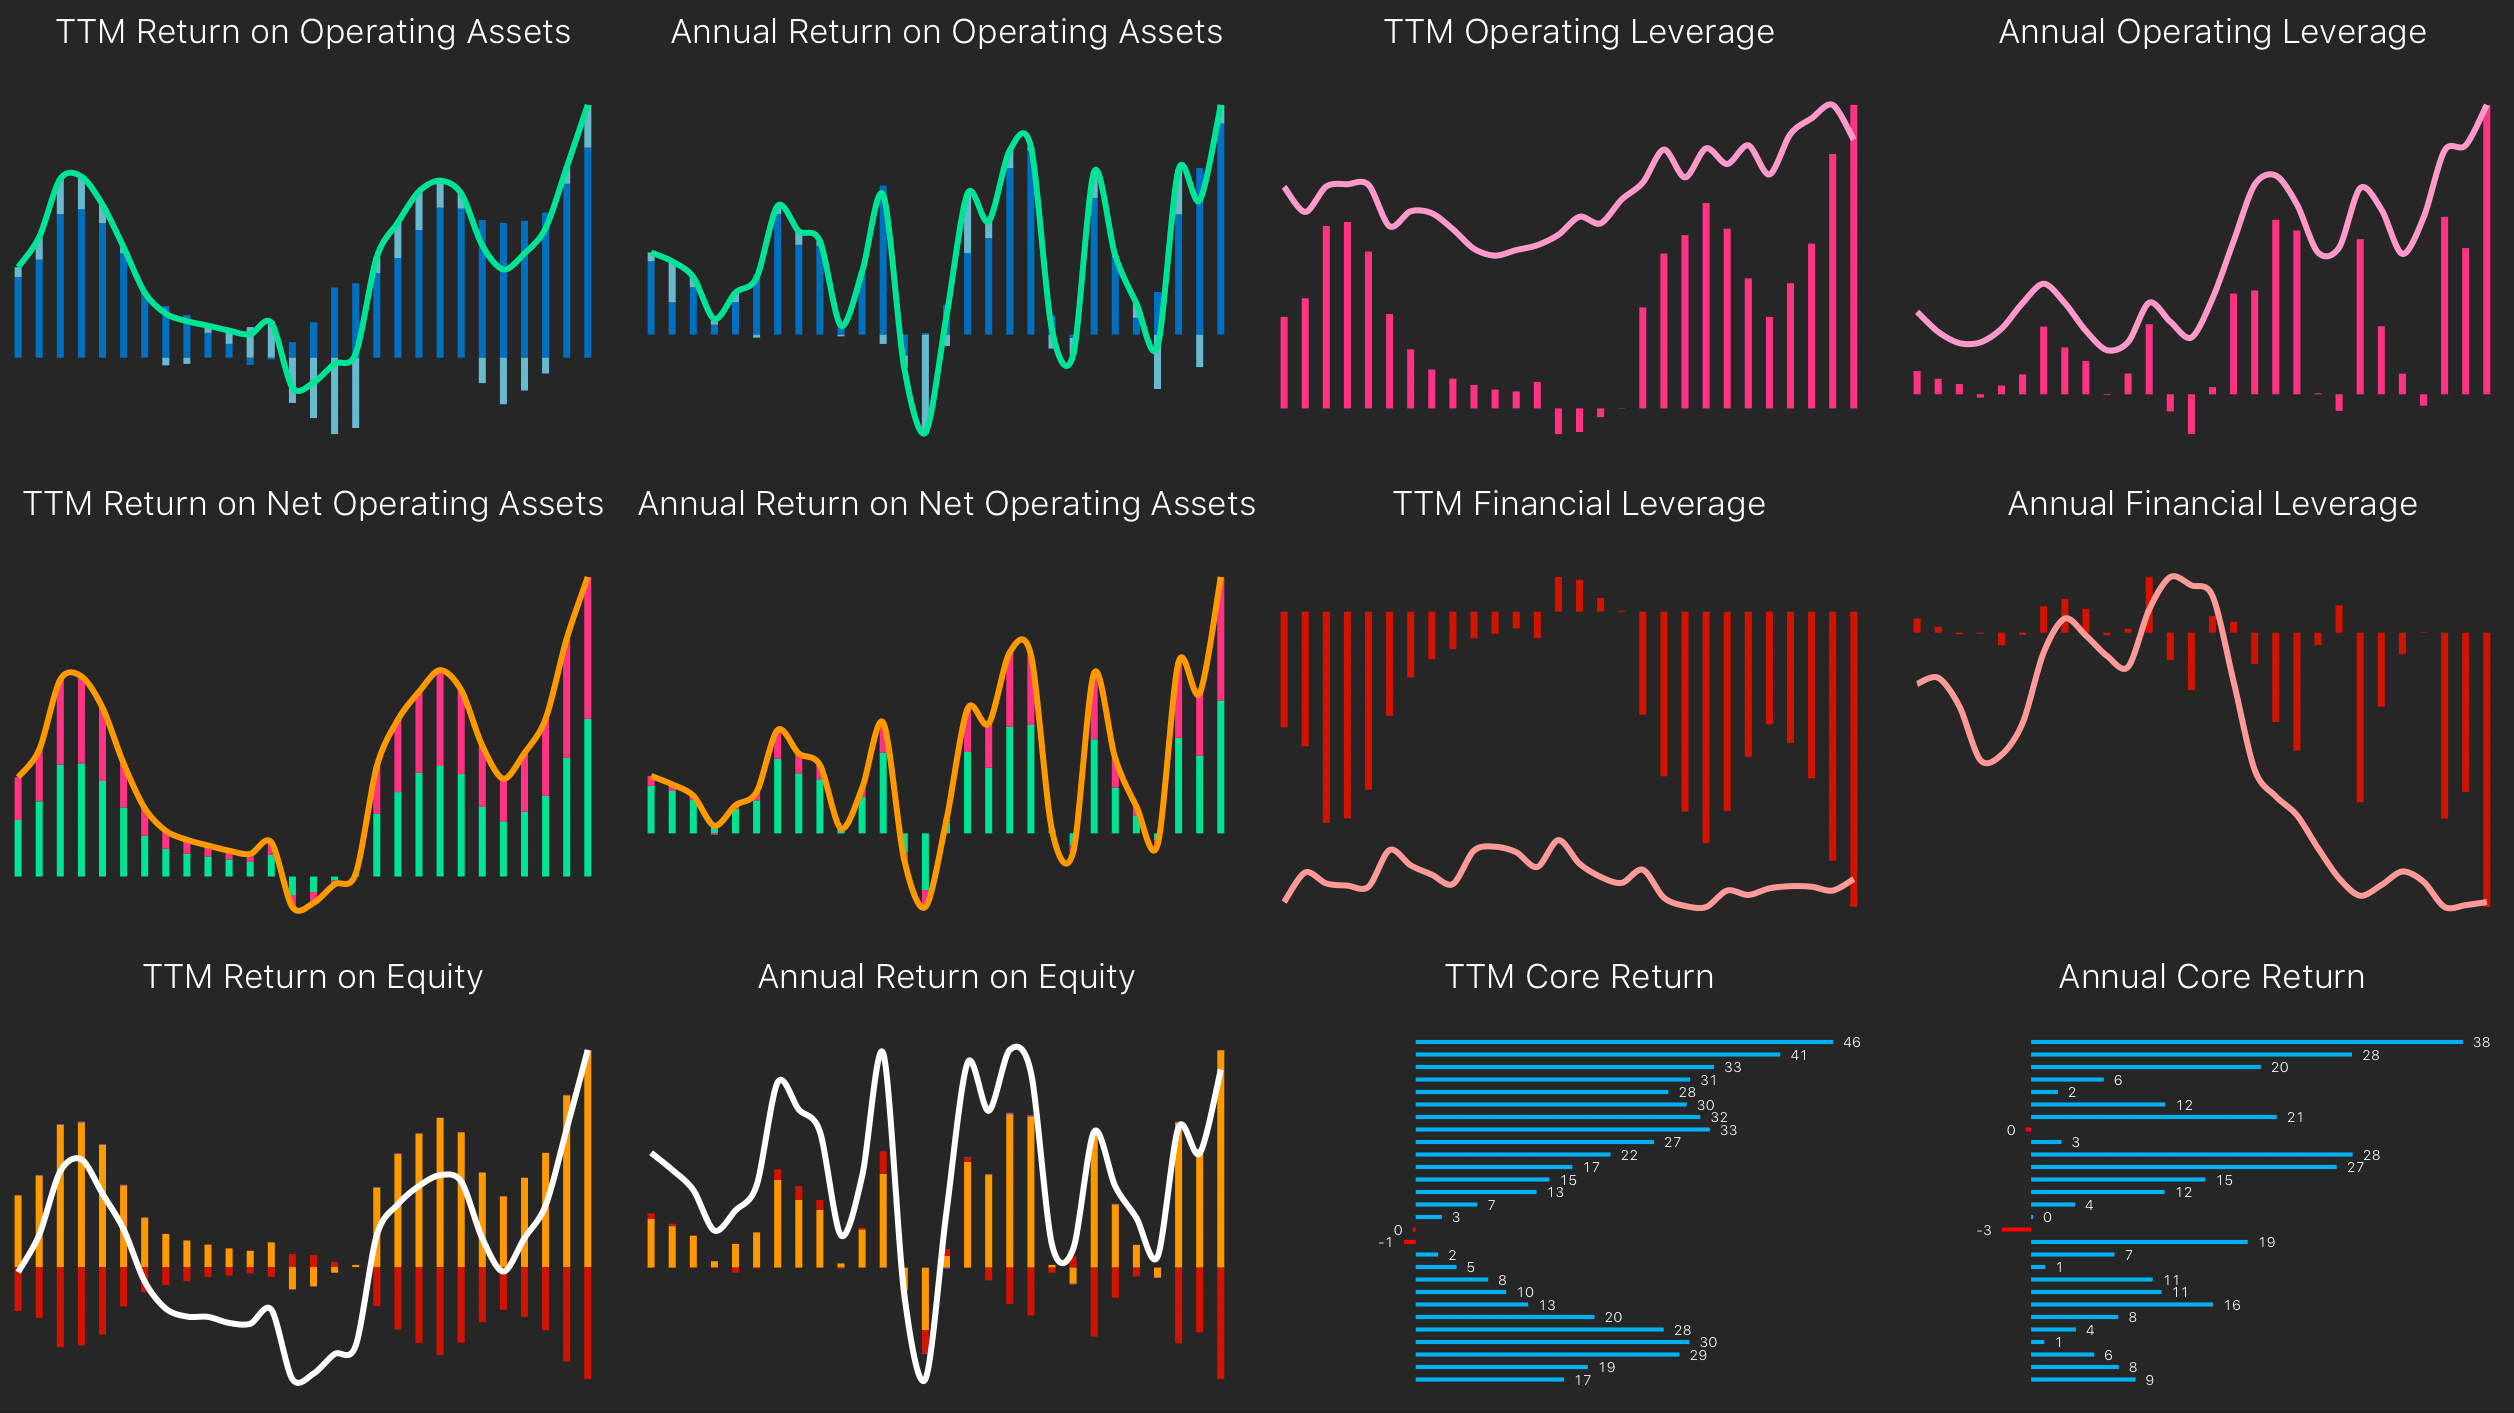
Return analysis focuses on the drivers of profitability in a business. Return on Equity which is Net Income divided by average Shareholder’s Equity (RoE) is a widely-used measure of profitability. RoE is however impacted by financial leverage and includes income from both operating and non-operating activities which distorts comparison between companies, even between those in the same industry.
This analysis segregates operating and financing activities and allows for the calculation of returns on both. Return on Net Operating Assets (RNOA) is Operating Income After Tax divided by Average Net Operating Assets. The Financial Leverage Effect (FLE) is Net Financial Liabilities divided by Average Equity multiplied by the ‘spread’ between RNOA and the cost of borrowing (NBC). RoE is the sum of RNOA and FLE (RoE = RNOA + FLE). Management can increase RoE by improving operating performance and raising RNOA. RoE can also be ‘improved’ by increased borrowing, provided RNOA exceeds NBC. A company with large amounts of cash will see this formula work in reverse to reduce RoE. Returns on cash and investments are currently lower than returns on operating assets for most businesses and, when applied to Net Financial Assets, the Financial Leverage Effect is negative.
RNOA can be further broken down into the Return on Operating Assets which is Operating Income plus Implicit Interest divided by Average Operating Assets (ROOA) and the Operating Leverage Effect (OLE) which is Operating Liability Leverage multiplied by the ‘spread’ between ROOA and NBC. Operating leverage is provided by suppliers who grant credit with no explicit interest charge which reduces the investment that would otherwise be required in Operating Assets. Operating Liabilities leverage the profitability of operations so the more Operating Liabilities relative to Operating Assets, the higher the Return on Net Operating Assets (assuming no effect on Operating Income).
In summary, RoE is impacted by both Operating and Financial Leverage. ROOA is levered to produce RNOA which is in turn levered to produce RoE.
In the last two charts, a distinction is made between the more sustainable Core Operating Income and Other Operating Income which produces what we consider to be the key measure of operating profitability for non-financial companies - the Core Return on Net Operating Assets. Core Return on Net Operating Assets is Core Operating Income After Tax divided by Average Net Operating Assets for the period expressed as a percentage.
A simple Residual Income model is employed to assess the historical and current relationship between a valuation based on the company accounts and forecast and the market’s valuation for the relevant period.
Residual Income is Core Operating Income less a charge for the use of the Net Operating Assets used to generate that income. Traditional accounting does not include a charge for the use of equity capital leaving it to the shareholders to determine if their opportunity cost has been covered. This analysis incorporates such a charge at a fixed rate for all companies.
Quarterly data are aggregated into trailing twelve-month (TTM) periods to eliminate the effect of seasonality. Where quarterly adjustment is not possible due to changes in fiscal year ends, the aggregation will not be made and the relevant periods will not be shown. For the purposes of comparison, annual changes are adjusted to reflect any change in the company's fiscal year-end by annualizing the fiscal year.
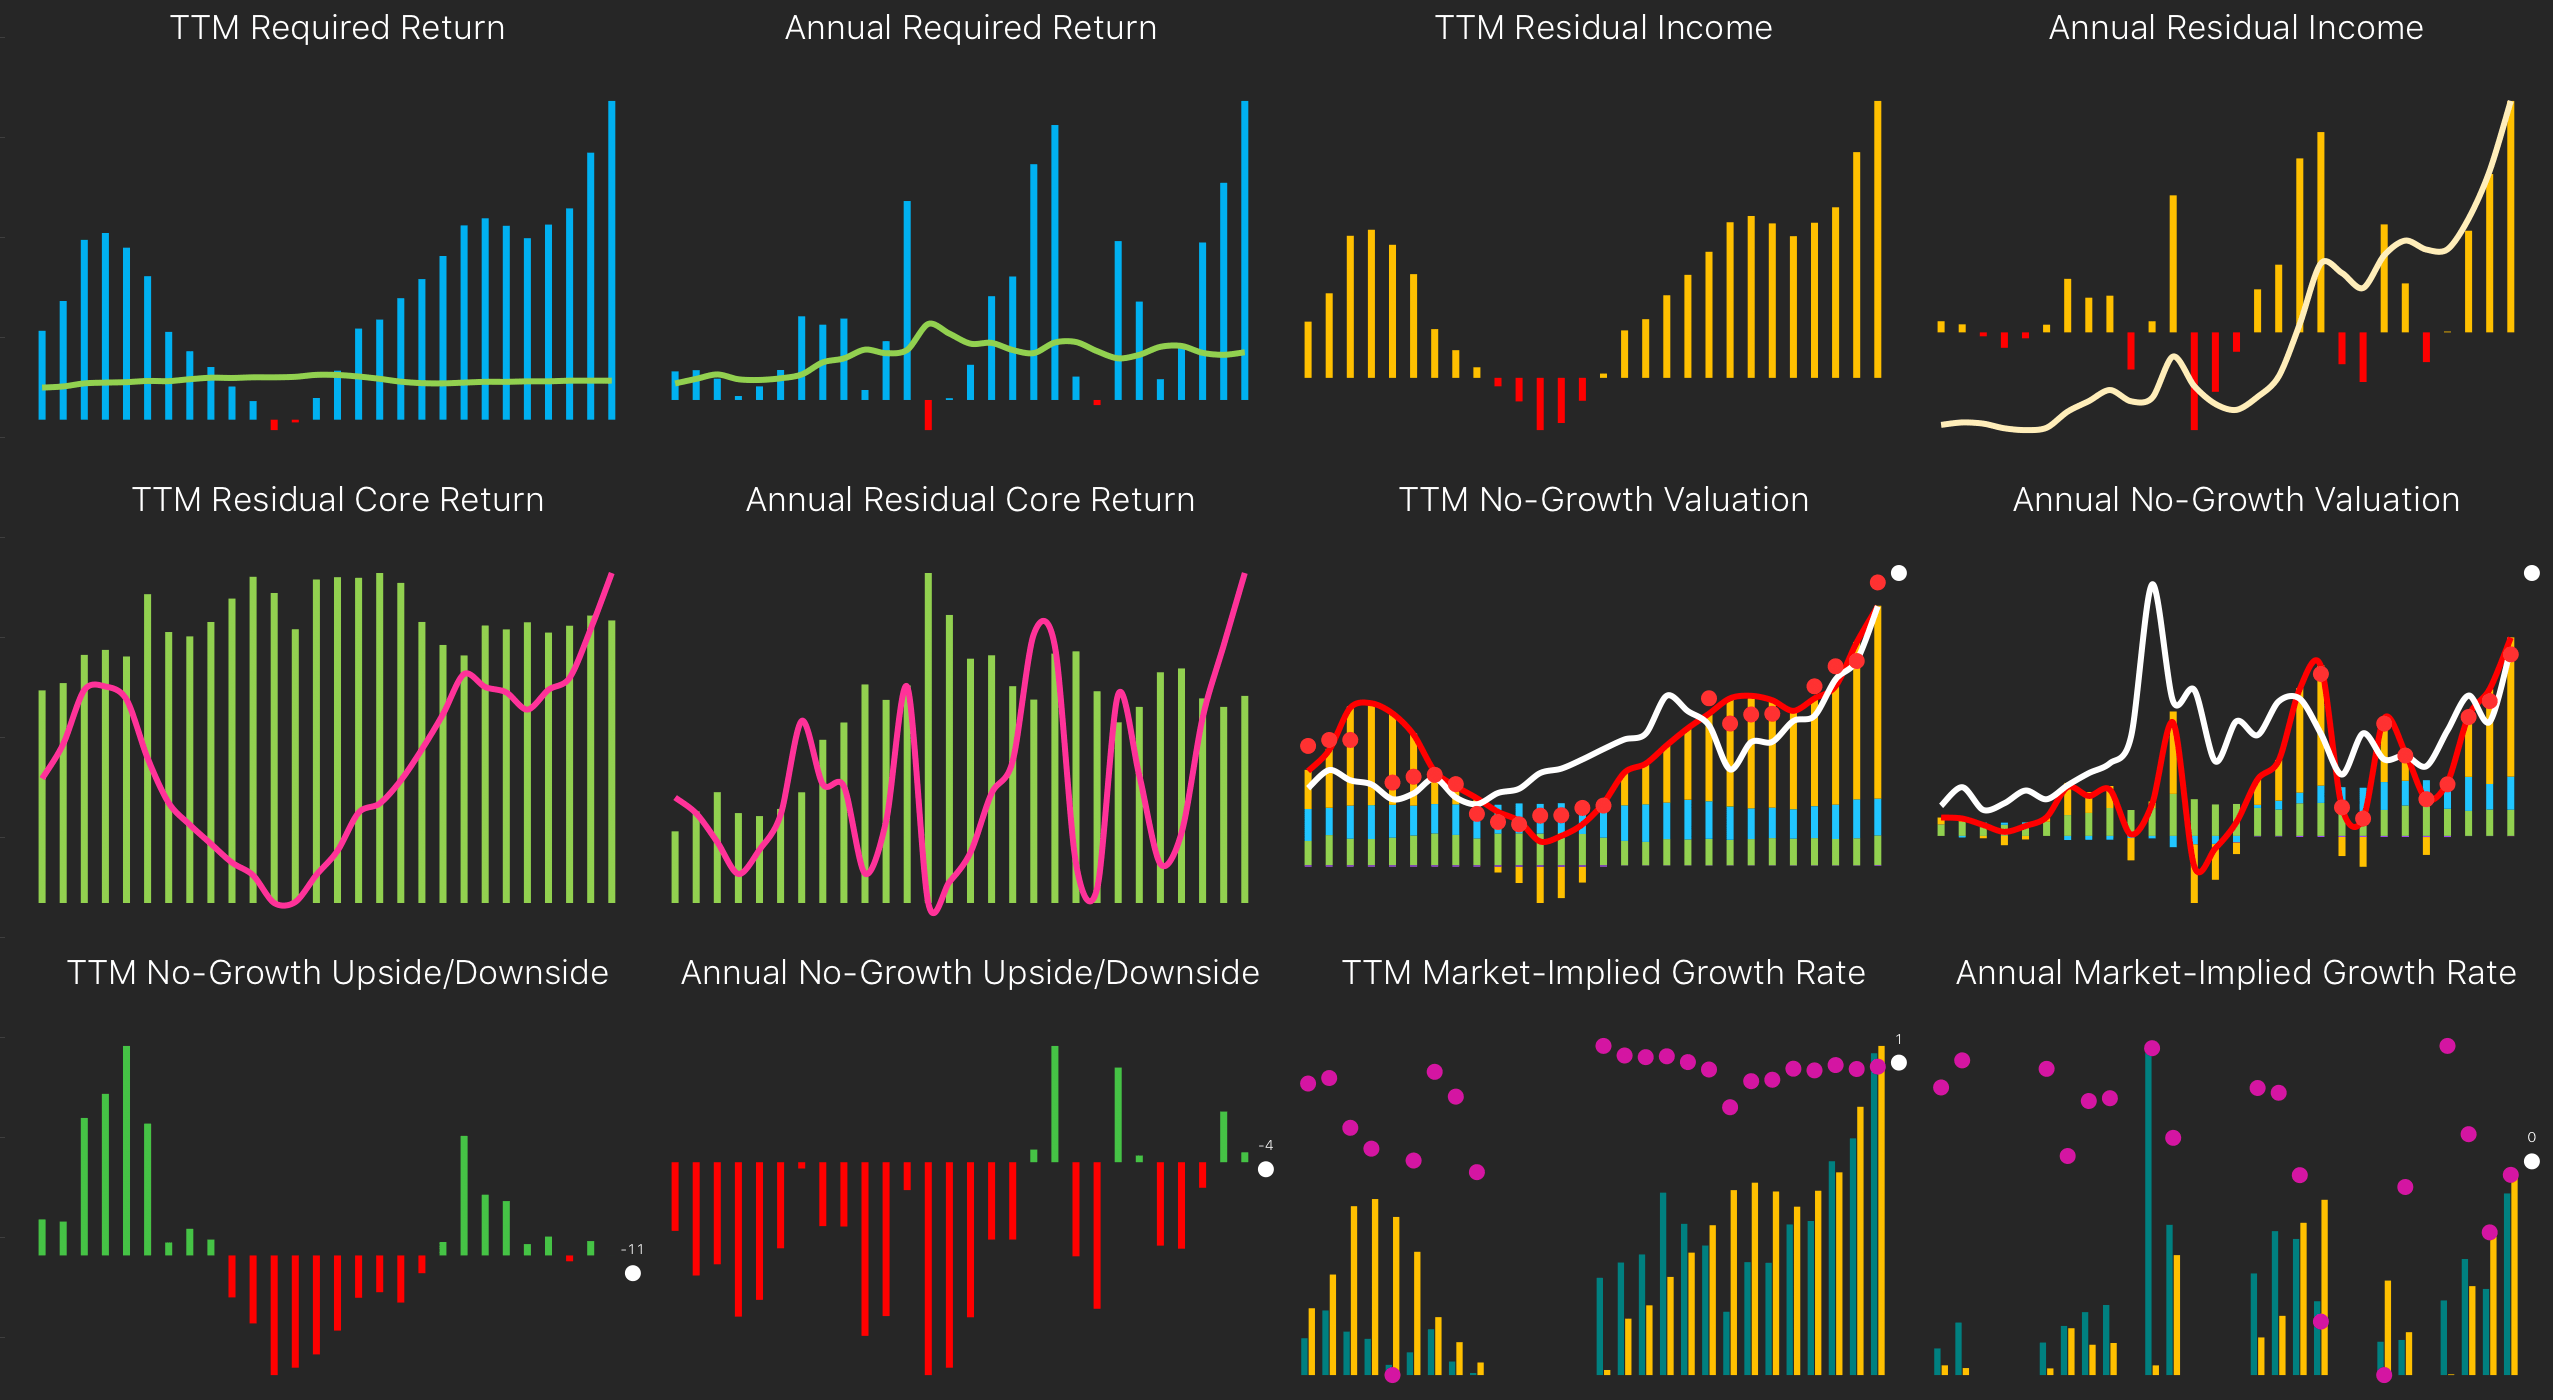
Required Return - Core Operating Income is Gross Profit less SG&A expenses and an estimated tax charge and is the most sustainable measure of profitability. It excludes non-recurring income and expenses, financial income and expenses and unrealized gains and losses as well as Minorities & Adjustments. The Required Rate of Return on Net Operating Assets Return is an annual charge for the use of Net Operating Assets and is applied only to the closing balance of Net Operating Assets for the previous year or the average of the four previous quarters. In this analysis, the Required Return has been fixed at 6%, an amount equal to the long-term rate of return for industrial companies in developed markets. No value is placed on any current and future financial activities and all financial assets and liabilities are deemed to be fairly valued.
Residual Return - Residual Return is Residual Income divided by Net Operating Assets for the period one year before expressed as a percentage. Residual return is driven by increases in Net Operating Assets or by an increase in the Residual Return on Net Operating Assets or both.
No-Growth Valuation Model - The Valuation model is anchored on Book Value to which is added an estimate of the value of future earnings. Book Value is the sum of Net Operating Assets and Net Financial Assets less Minorities and Preference Shares. The value of future earnings is represented by the Residual Income for the period capitalized at 6% (or multiplied by 16.7 times) and assumes that there is no growth in future Residual Income. The resulting No-Growth Valuation is the sum of Adjusted Book Value and Capitalized Residual Income. It is presented both with an assumption of perfect hindsight and also using the last forecast of Operating Income released by the company prior to the announcement of results for the relevant period. The two valuations are compared with the sum of Market Capitalization and Dividends Paid in each period. A premium over Market Capitalization and Dividends Paid is a measure of the value the market is placing on future growth or, in the case of negative Residual Income, an expectation of a return to positive Residual Income. A discount to Market Capitalization and Dividends Paid indicates either an under-valuation or an expectation that the current positive Residual Income is not sustainable and will decline. Where the company has made a forecast of Operating Income for the current fiscal year, the No-Growth Valuation derived from that forecast is presented as well as the Current Market Capitalization.
No-Growth Upside/Downside - Any difference between the current Share Price and the No-Growth Valuation per Share is either a Premium or Discount per Share. The difference is presented in percentage terms as an Upside or Downside to the then Current Share Price. The difference between the current Share Price and the latest TTM Value per Share and any current fiscal year forecast-based value are also shown.
Market-Implied Growth - The No-Growth Valuation Model can be used to calculate the rate of growth in Residual Income that is implied by the current market valuation. This ‘reverse-engineering’ is only applied where the market value exceeds book value and where Residual Income is positive. Market Capitalization less Shareholder’s Equity represents the premium that the market is willing to pay for future Residual Income. Capitalized Residual Income is the Residual Income for the relevant period capitalized at 6% and assuming no growth. The Market-Implied Residual Income Growth is the rate by which Capitalized Residual Income has to grow per year in order to eliminate the market premium over Book Value. Where the market premium is less than the Capitalized Residual Income, the Market-Implied Residual Income Growth rate will be negative.
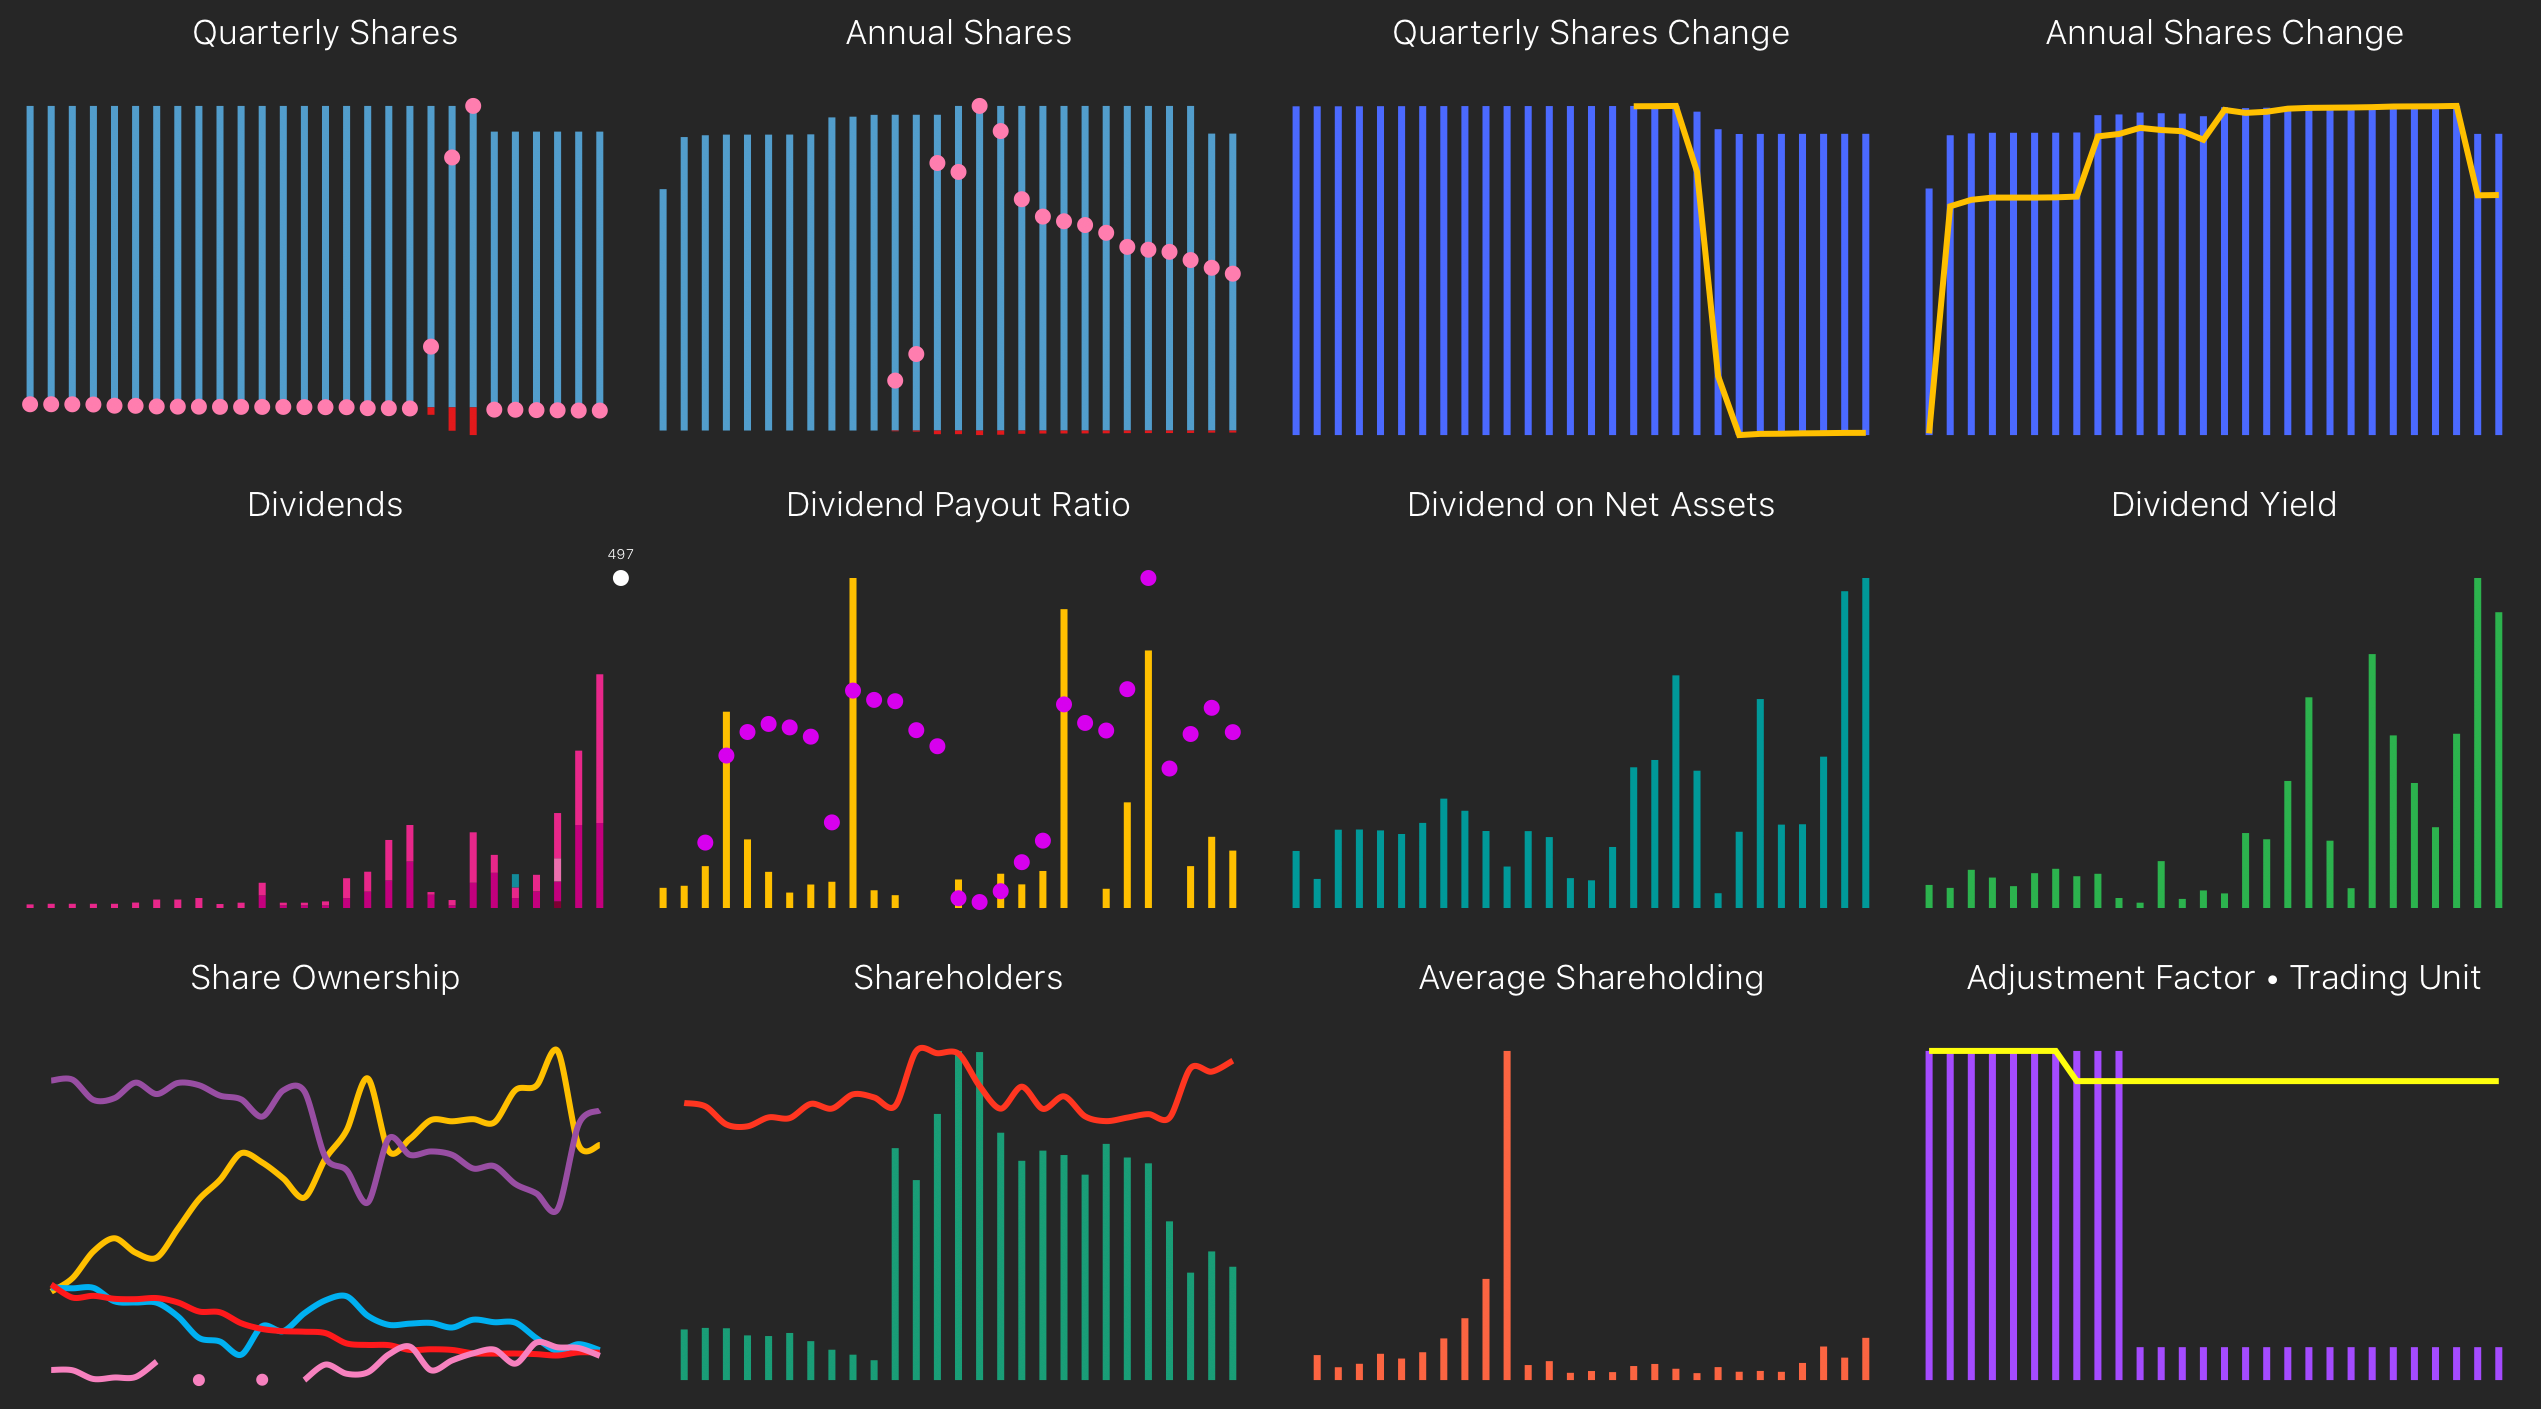
With much emphasis being placed on dividend policy and share buybacks, the App provides a full quarterly and annual history of shares issued and treasury stock with a cumulative total percentage change in the net shares outstanding. A complete dividend history is provided by period made and by type as well the ratios of dividends to and income, net assets and share price. Timelines of shareholders by class, the number of shareholders, the ratio of top 10 shareholders and the value of the average holding size are also presented.
Shares - Common Shares is the total number of Shares issued. Treasury Stock is the number of Shares held by the company that have not been cancelled and is presented here as a negative amount. Treasury/Common is Treasury Stock divided by Common Shares expressed as a percentage. Amounts of Treasury Stock/Common of less than 0.1% have been omitted. All amounts are adjusted to reflect past stock splits. The number of Non-Voting and Voting Preference Shares is also presented adjusted to reflect past stock splits.
Shares Change - Cumulative Change in Net Shares Outstanding % is the sum of the changes in Common Shares Treasury Stock and Preference Shares divided by number of Net Shares Outstanding for the periods shown expressed as a percentage. All amounts are adjusted to reflect past stock splits. Changes between -0.1% and 0.1% have been omitted.
Dividends - Dividends paid to Shareholders are sub-divided by period and type. Ordinary Dividends are normally paid at Fiscal Year Ends, but can occasionally be paid at the end of the first, second and third quarters. Commemorative and Extraordinary Dividends are normally paid at the Interim or Fiscal Year End but are grouped together in this analysis. All amounts are adjusted to reflect past stock splits. Where the company has forecast a Dividend for the current fiscal year, the amount to be paid is included for reference. Note that this amount may reflect future stock splits and may not be comparable with the historical data series.
Dividend Payout Ratio - Dividend Payout Ratio is the total amount per Share of Dividends paid during a period (DPS) divided by the Earnings per Share (EPS) for the period expressed as a percentage. Amounts of less than zero and greater than 200% have been omitted. A 5-year average is also presented where that average is between -100 and 100%.
Dividend on Net Asset - Cash Flow Dividend on Net Assets is the total Dividends paid during a period divided by the average amount of Net Assets for the period expressed as a percentage.
Dividend Yield - Dividend Yield is the total Dividends paid during a period divided by the closing Market Value for the period expressed as a percentage.
Share Ownership - Share Ownership is sub-divided by type of investor and expressed as a percentage of the total Shares Outstanding. Foreigners are non-resident investors. Individuals are Japanese residents and others who are not Corporations, Financial Institutions or Government entities. Corporations are corporate entities that are not Financial Institutions. Financial Institutions are banks, insurance companies or other financial institutions except Brokers. Government includes national and local Government entities.
Shareholders - Number of Shareholders is the total number of registered Shareholders at the end of each period. Top 10 Shareholders is the number of Shares held by the largest ten Shareholders divided by the total number of Shares Outstanding expressed as a percentage.
Average Shareholding - Average Holding Size is the Market Capitalization at the end of the relevant period divided by the Number of Shareholders.
Adjustment Factor & Trading Unit - Shares per Trading Unit is the minimum lot size in terms of Shares by which the company's Shares are traded on the relevant stock exchange(s), and is usually 1,000 or 100 shares. Companies may reduce the number in order to make investing in the company's Shares more affordable for individual investors. The Cumulative Adjustment Factor for Corporate Actions is the adjustment that is made to all per Share numbers in this analysis to reflect past Stock Splits, Reverse Stock Splits and Rights Conversions.
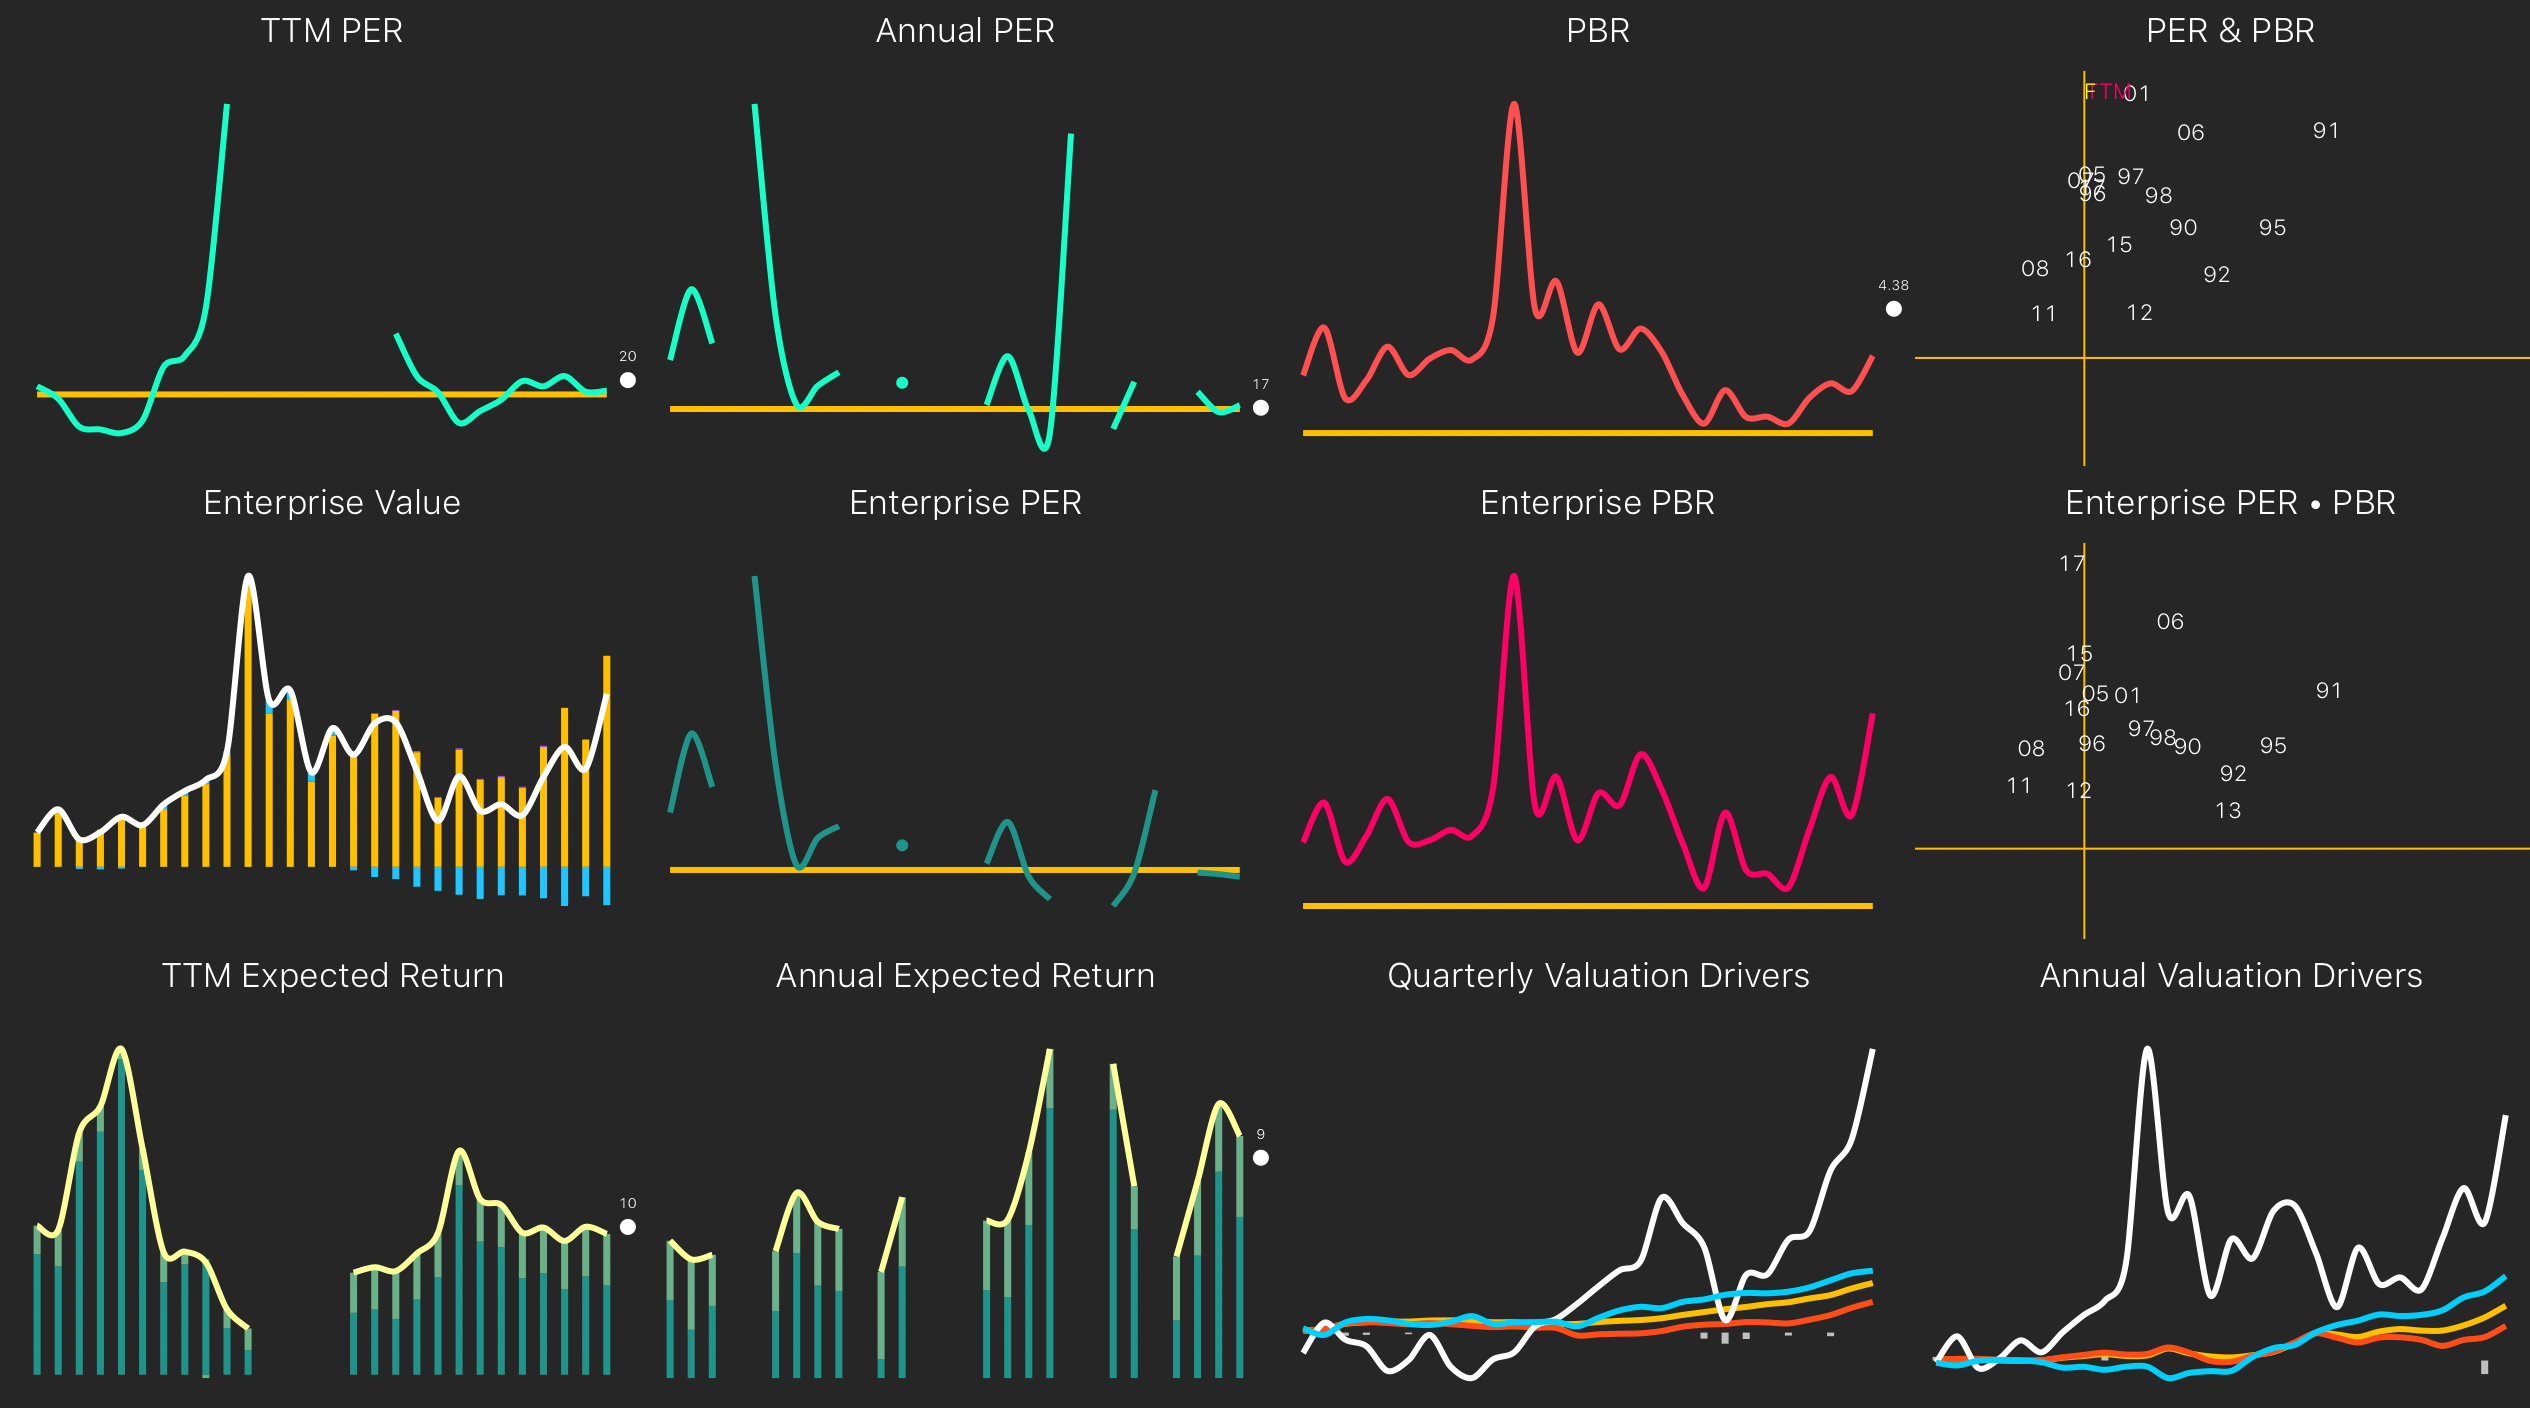
PER - The Price to Earnings ratio (PER) is a traditional measure of valuation. The historical PER is calculated by dividing the Market Capitalization at the end of the period plus the Dividends paid during the period by relevant amount of Net Income. The PER using the current market capitalization and the TTM Net Income is also shown. Periods where the company reported a loss or periods where one of the ratios exceeds 100x are omitted. For the purposes of comparison, annual changes are adjusted to reflect any change in the company's fiscal year-end by annualizing the fiscal year. If a forecast of Net Income for the current fiscal year is disclosed, a PER based on that forecast is added for reference and is calculated by dividing the current Market Capitalization by the forecasted Net Income. PERs are a multiple of earnings after net interest expense and are therefore affected by leverage. Favorable leverage can create earnings growth that lowers the PER. Investors should be careful not to overpay for leverage-induced growth. A line is drawn at PER of 16.67 which can be considered as a ‘normal’ valuation for a company with residual income equal to 6% of Net Operating Assets and with no prospects of growth.
PBR - The Price to Book ratio (PBR) is another traditional measure of valuation. The PBR is calculated by dividing the Market Capitalization at the end of the period by Total Net Assets after deducting Minority Interests, Warrants and any Preferred Stock. Periods where the ratio is less than zero or exceeds 50x have been omitted. The current PBR calculated using the most recent quarterly Net Assets per Share is also shown. PBRs can be increased or decreased by leverage. Investors should be careful to avoid comparisons based only on differences in financing. A line is drawn at PBR of 1.0 which can be considered as a ‘normal’ valuation for a company with Residual Income equal to 6% of Net Operating Assets and with no prospects of growth.
PBR & PER - Up to 28 years of PER and PBR ratios are plotted to illustrate the relationship between growth and risk which together are indicators of expected stock return. The PER is an indicator of expected future growth; the higher the ratio, the higher the expected growth. The PBR helps to sort out the degree to which growth is factored into the stock price. A low PBR indicates growth that is not reflected in the stock price but also carries a higher degree of risk. A high PBR indicates that the much of the expected growth is already in the price, but that growth is lower risk and therefore will yield a lower return. Note that PBR is only indicative of growth when combined with the PER and that the lower the PBR, the higher the indicated growth. Lines have been drawn at a PBR of 1.0 and a PER of 16.67 and their intersection can be considered as a ‘normal’ valuation for a company with Residual Income equal to 6% of Net Operating Assets and with no prospects of growth. Where the company has released a forecast of Net Income for the current fiscal year, the PER based on that forecast and the current PBR is labeled as "F." The PER for the most recent TTM period and the current PBR is labelled “TTM”. Periods where the company made a loss have been omitted as have periods where the PBR is less than zero or exceeds 50x or the PER exceeds 70x.
Enterprise Value - Enterprise Value is the theoretical cost of acquiring the company as any buyer would have to assume the company's financial assets or liabilities as well as its equity. It is useful when comparing companies with different capital structures. Enterprise Value is the sum of Market Capitalization, Net Financial Assets/Liabilities and Preferred Shares plus Minority Interests and Warrants both multiplied by the PBR. Enterprise Value can be negative if the company holds large amounts of cash and investments and their value is not reflected in the market value of the equity.
Enterprise PER - The Enterprise or Unlevered PER is a variation that removes the effect of leverage and is calculated by dividing the Enterprise Value at the end of the period plus the Free Cash Flow for the period by relevant amount of Net Operating Income After Tax. Periods where the company reported a loss or where the ratio exceeds 100x have been omitted. For the purposes of comparison, annual changes are adjusted to reflect any change in the company's fiscal year-end by annualizing the fiscal year.
Enterprise PBR - The Enterprise or Unlevered PBR is a variation that removes the effect of leverage and is calculated by dividing the Enterprise Value at the end of the period by the relevant amount of Net Operating Assets. Periods where the ratio is less than zero or exceeds 50x have been omitted.
Enterprise PER & PBR - Using the same framework as the PER and PBR chart, up to 28 years of Enterprise PER and PBR ratios are plotted to illustrate the relationship between growth and risk which together are indicators of expected stock return
Expected Return - Expected Return is a measure of the return that can be expected from buying the company's shares at the current market price and is a combination of short-term return and subsequent growth weighted by the Enterprise PBR. The short-term return is the current Enterprise Earnings Yield or Net Operating Profit After Tax divided by Enterprise Value expressed as a percentage. The expected return from subsequent growth is calculated by applying a growth rate (4% is used as a reference) to 1 minus the reciprocal of the Enterprise PBR ratio and is expressed as a percentage. The combined total expected return can then be compared with an investor's target rate of return and the relative weight between the short-term and growth components can be assessed against the investor's own expectations of a company's growth rate as an indicator of the risk that is embedded in the current price. The Expected Return is presented for both annual and trailing twelve-month (TTM) periods. For the purposes of comparison, annual changes are adjusted to reflect any change in the company's fiscal year-end by annualizing the fiscal year.
Valuation Drivers - As an illustration of the company's progress over time, the key valuation drivers, Cumulative Residual Income and Cumulative Residual Comprehensive Income are compared to the Incremental Market Capitalization plus Dividends from the same starting point up to the current period. Residual Income is Core Operating Income After Tax and Minorities less a charge for the use of the Net Operating Assets used to generate that income. Traditional accounting does not include a charge for the use of equity capital leaving it to the shareholders to determine if their opportunity cost has been covered. This analysis incorporates such a charge at a fixed rate of 6% for all companies. Residual Comprehensive Income is Comprehensive Income to Common Equity less a 6% charge on Shareholders’ Equity. For companies with substantial portfolio investments this is often a better valuation driver as Comprehensive Income includes unrealized Valuation Differences that are reflected on the Balance Sheet but are not included in Core Operating Income. Net Change in Capital shows the impact of changes in Equity & Reserves on Incremental Market Capitalization plus Dividends. For reference, the cumulative amount of Free Cash Flow is added although in our analysis we do not consider Free Cash Flow to be a valuation driver.
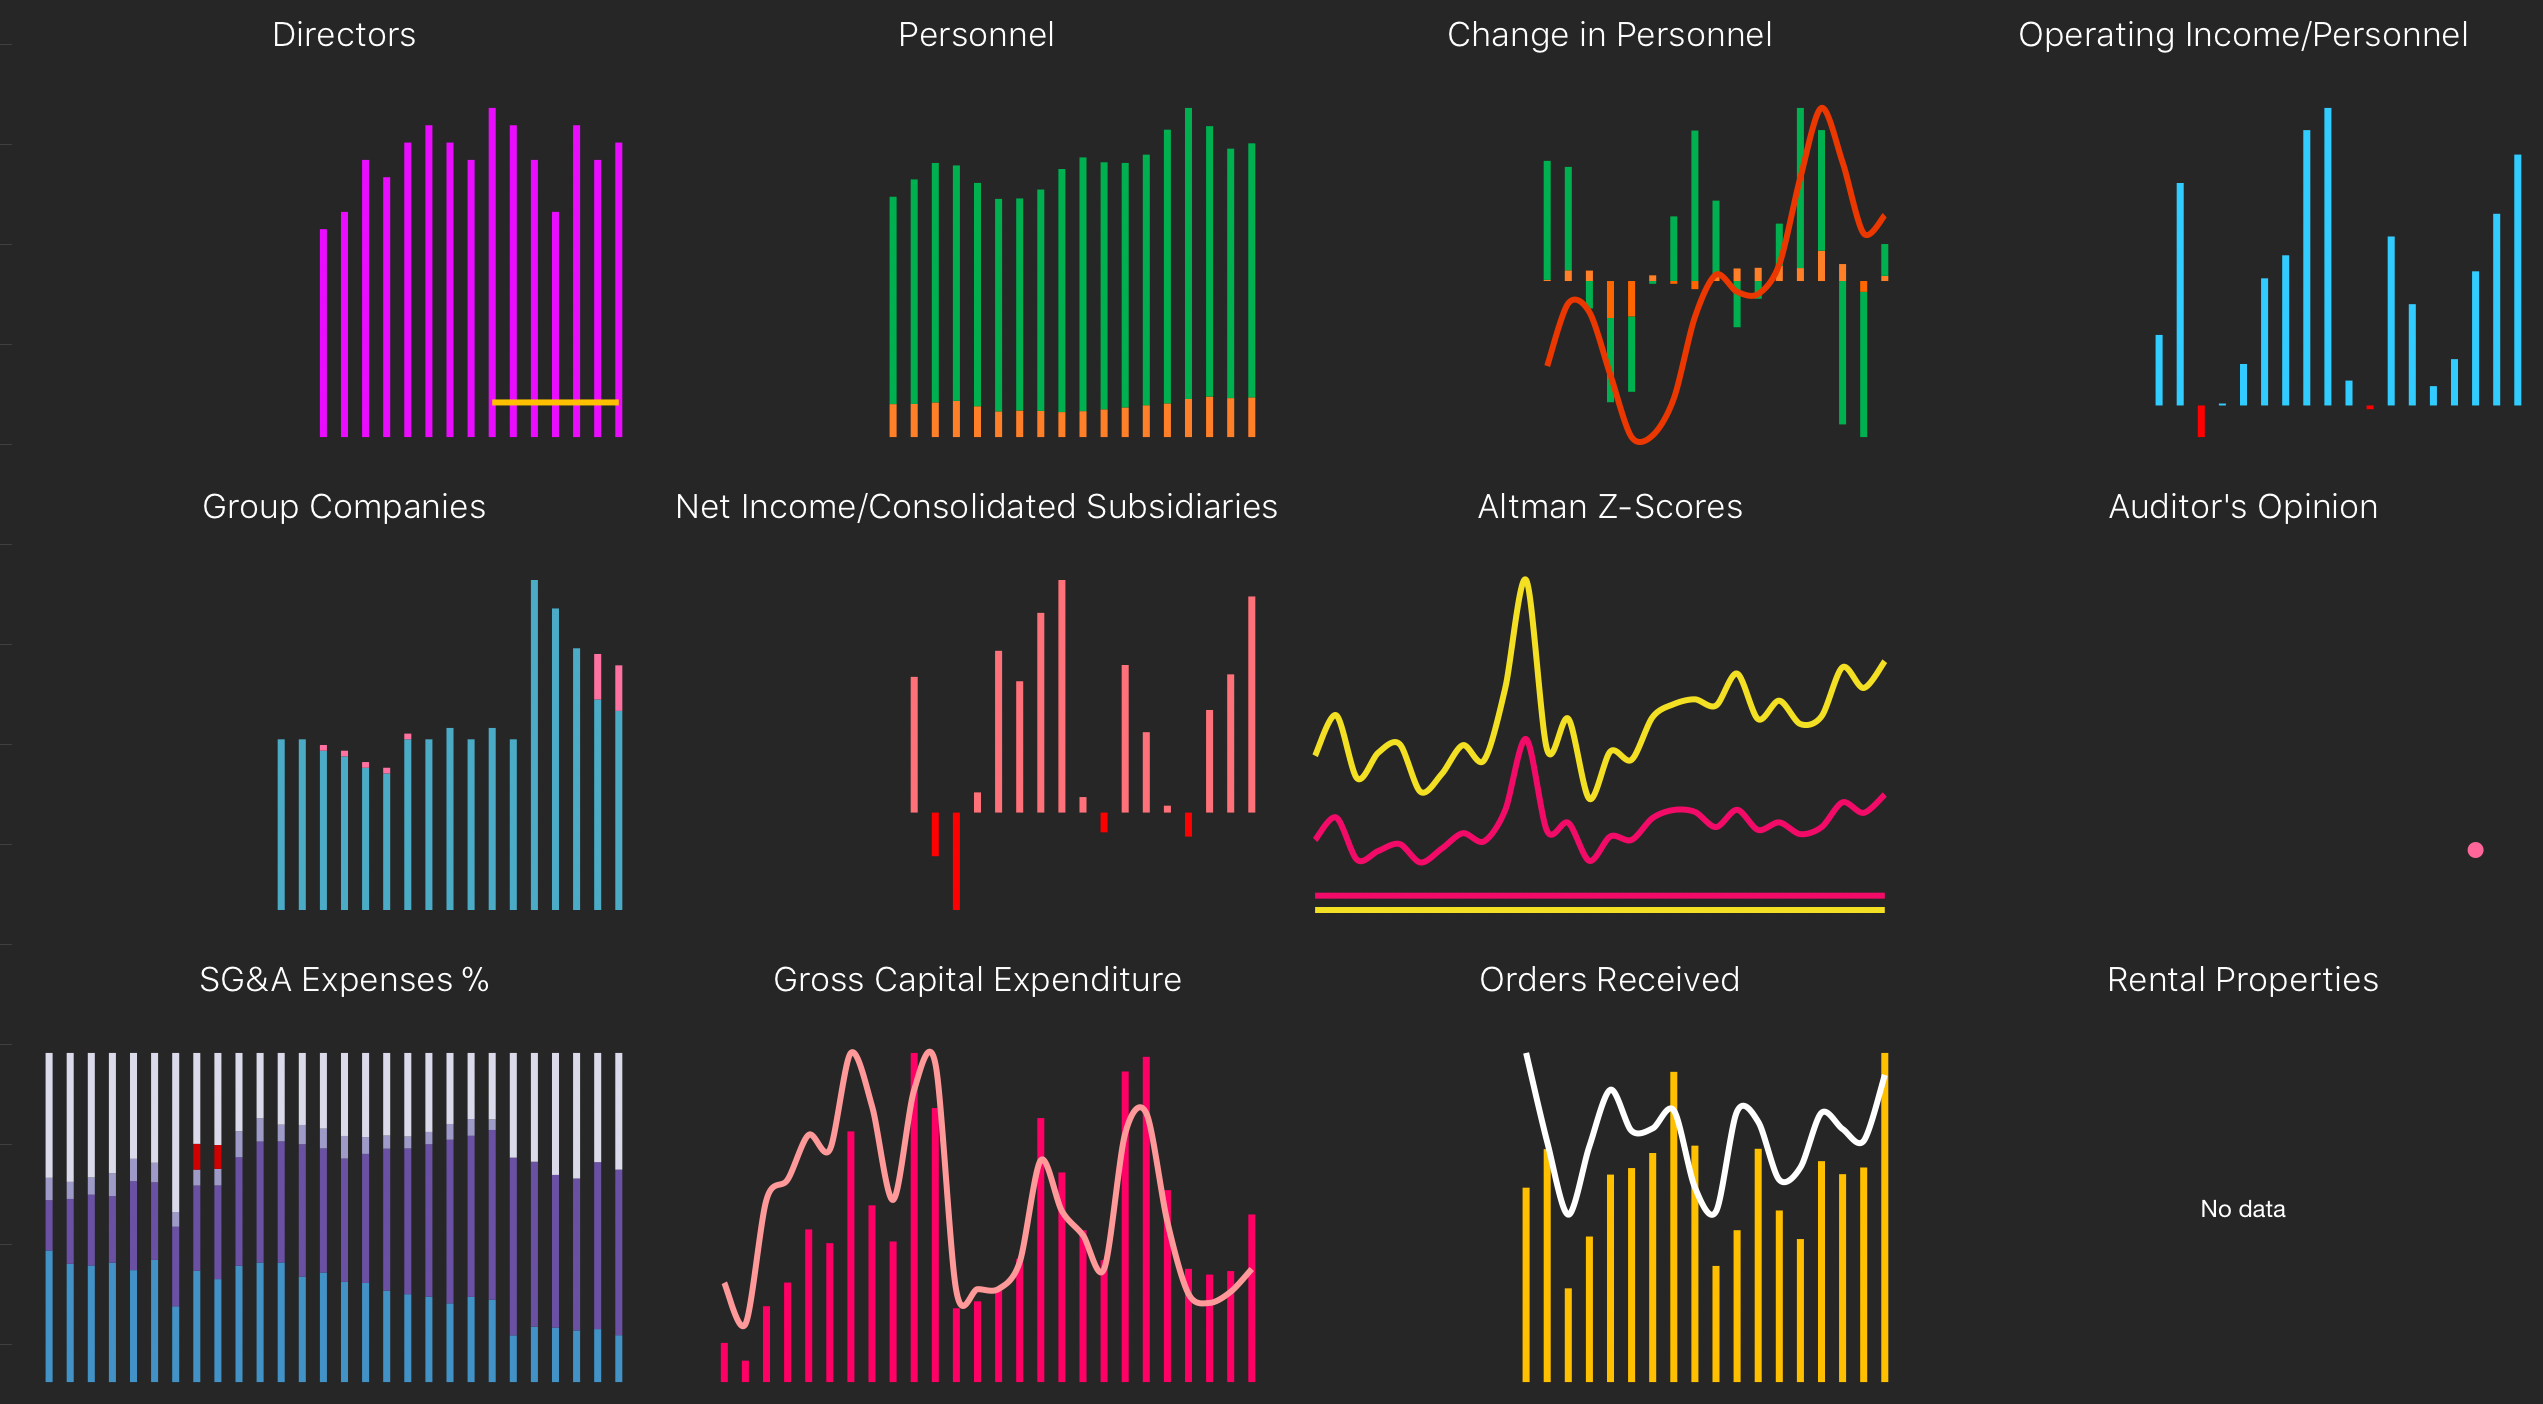
Board composition is now a focus for many investors. We track the history of the number of directors as well as the number of independent and female directors. In addition, we provide the history of the number of employees divided by type and status and the number and type of subsidiaries. Unique to the App, we present the history of auditor’s opinions that are not ‘Unqualified Without Comment’ as well as any instances of a re-audit and a flag if the company itself has raised concerns about its status as a going concern. This information is not available from any other source in this format at present.
Directors - The size and composition of the Board of Directors has become a focus for investors concerned about corporate governance. Japan's Corporate Governance Code (which is mandatory for companies listed on the First and Second Sections of the Tokyo Stock Exchange) requires the appointment of at least two independent outside Directors or an explanation of the reasons why this requirement cannot be met. Board size has only been disclosed routinely from 2003. Disclosure includes both the number of Outside Directors and the number of Independent Directors within Outside Directors. The latter number is used in this analysis. The number of female members of the Board of Directors is also now disclosed. The number of Independent Directors and the number of Female Directors are both independent subsets of the total number of Directors. A female Independent Director will be counted both as an Independent Director and a Female Director. We do not consider Statutory Auditors to be members of the Board and they are excluded from this analysis.
Personnel - The disclosure of numbers and categories of Personnel varies from company to company and from year to year. With the increasing use of temporary staff, it is no longer appropriate to consider only the number of permanent staff when evaluating a company's performance. Many companies however do not disclose the number of their temporary staff. The numbers of permanent and temporary staff are presented as averages. For consolidated companies, the numbers of parent company permanent and temporary staff and group permanent and temporary staff are presented separately.
Change in Personnel - Change in Personnel measures the change in each category of Personnel for each period. Note that some changes may be driven only by variances in disclosure. Cumulative change in Personnel is the cumulative total of the changes in average Personnel for the period shown divided by total average Personnel and expressed as a percentage.
Operating Income/Personnel - Operating Income/Personnel is the Operating Income for the period divided by the average number of total Personnel for the same period expressed as a percentage. The disclosure of numbers and categories of Personnel varies from company to company and from year to year and the ratios presented here may be affected by such variances. For the purposes of comparison, annual amounts are adjusted to reflect any change in the company's fiscal year-end by annualizing the fiscal year. This ratio has been derived from the company's Income and Supplementary Statements and does not appear in the audited accounts.
Group Companies - For consolidated companies, the size and scope of the Group is disclosed. Prior to April 1999 under J-GAAP, Consolidated Financial Statements were provided as a supplemental to the audited parent accounts and the scope of consolidated was limited to only those companies in which the parent company held more than 50% of the shares. In exceptional cases, even those could be omitted. Equity accounting for unconsolidated subsidiaries and affiliates was recommended but not required. From 1999, audited Consolidated Financial Statements were required and the scope of consolidation was broadened to include companies in which the parent held less than 50% but exercised 'substantive control.' Equity accounting was required for affiliates in which the share ownership was above 20% or above 15% if there was 'substantive control.' As a result, many Japanese companies substantially revised their group structure from 1999 to 2001 and the disclosure is not consistent for some companies during this period. Accordingly, data from before 2001 are omitted. Equity Accounted Subsidiaries include both unconsolidated subsidiaries and related companies that are equity accounted.
Net Income/Consolidated Subsidiaries - As measures of the efficiency of Group operations, the ratio of Net Income per Consolidated Subsidiary is presented. Note that this ratio may not be directly comparable for all periods due to variances in disclosure. Net Income has been adjusted to reflect any change in the company's fiscal year-end by annualizing the fiscal year.
Altman Z-Scores - The Altman Z-Score is a traditional formula for predicting bankruptcy. It was devised by Edward Altman in 1968. The Z-score is a linear combination of common business ratios, weighted by coefficients. The coefficients were estimated by identifying a set of firms which had declared bankruptcy and then collecting a sample of firms which had survived, with matching by industry and approximate size (assets).
Auditor’s Opinion - A summary of the Auditor's Opinion for each period is given. The following Opinions are included: Contingent Events, Post Balance Sheet Events, Material Differences, Going Concern Opinion, Adverse Opinion, Disclaimer of Opinion. In addition, “Re-Audit” indicates that the accounts for the period have been re-audited. Where a company has itself reported that is has doubts about its status as a going concern that is also highlighted.
SG&A Expenses % - Only half of listed companies provide a breakdown of Selling, General & Administrative Expenses and the disclosure differs between Parent and Consolidated accounts. The depth of disclosure also varies from company to company and from year to year by the same company.
Gross Capital Expenditure - As a measure of capital expenditure and where disclosed, the amount of Gross Additions to Property, Plant & Equipment is presented. Gross Additions to PP&E/Total Assets is Gross Additions to Property, Plant & Equipment divided by Total Assets for the period expressed as a percentage. This ratio has been derived from the company's Income and Supplementary Statements and does not appear in the audited accounts.
Orders Received - Where disclosed, we present Orders Received divided into Domestic and Export and also compared to Revenue expressed as a percentage.
Rental Properties - If the company rents out any property we present the book value of the property, any fair value adjustment and the yield on the property.
Financial Companies
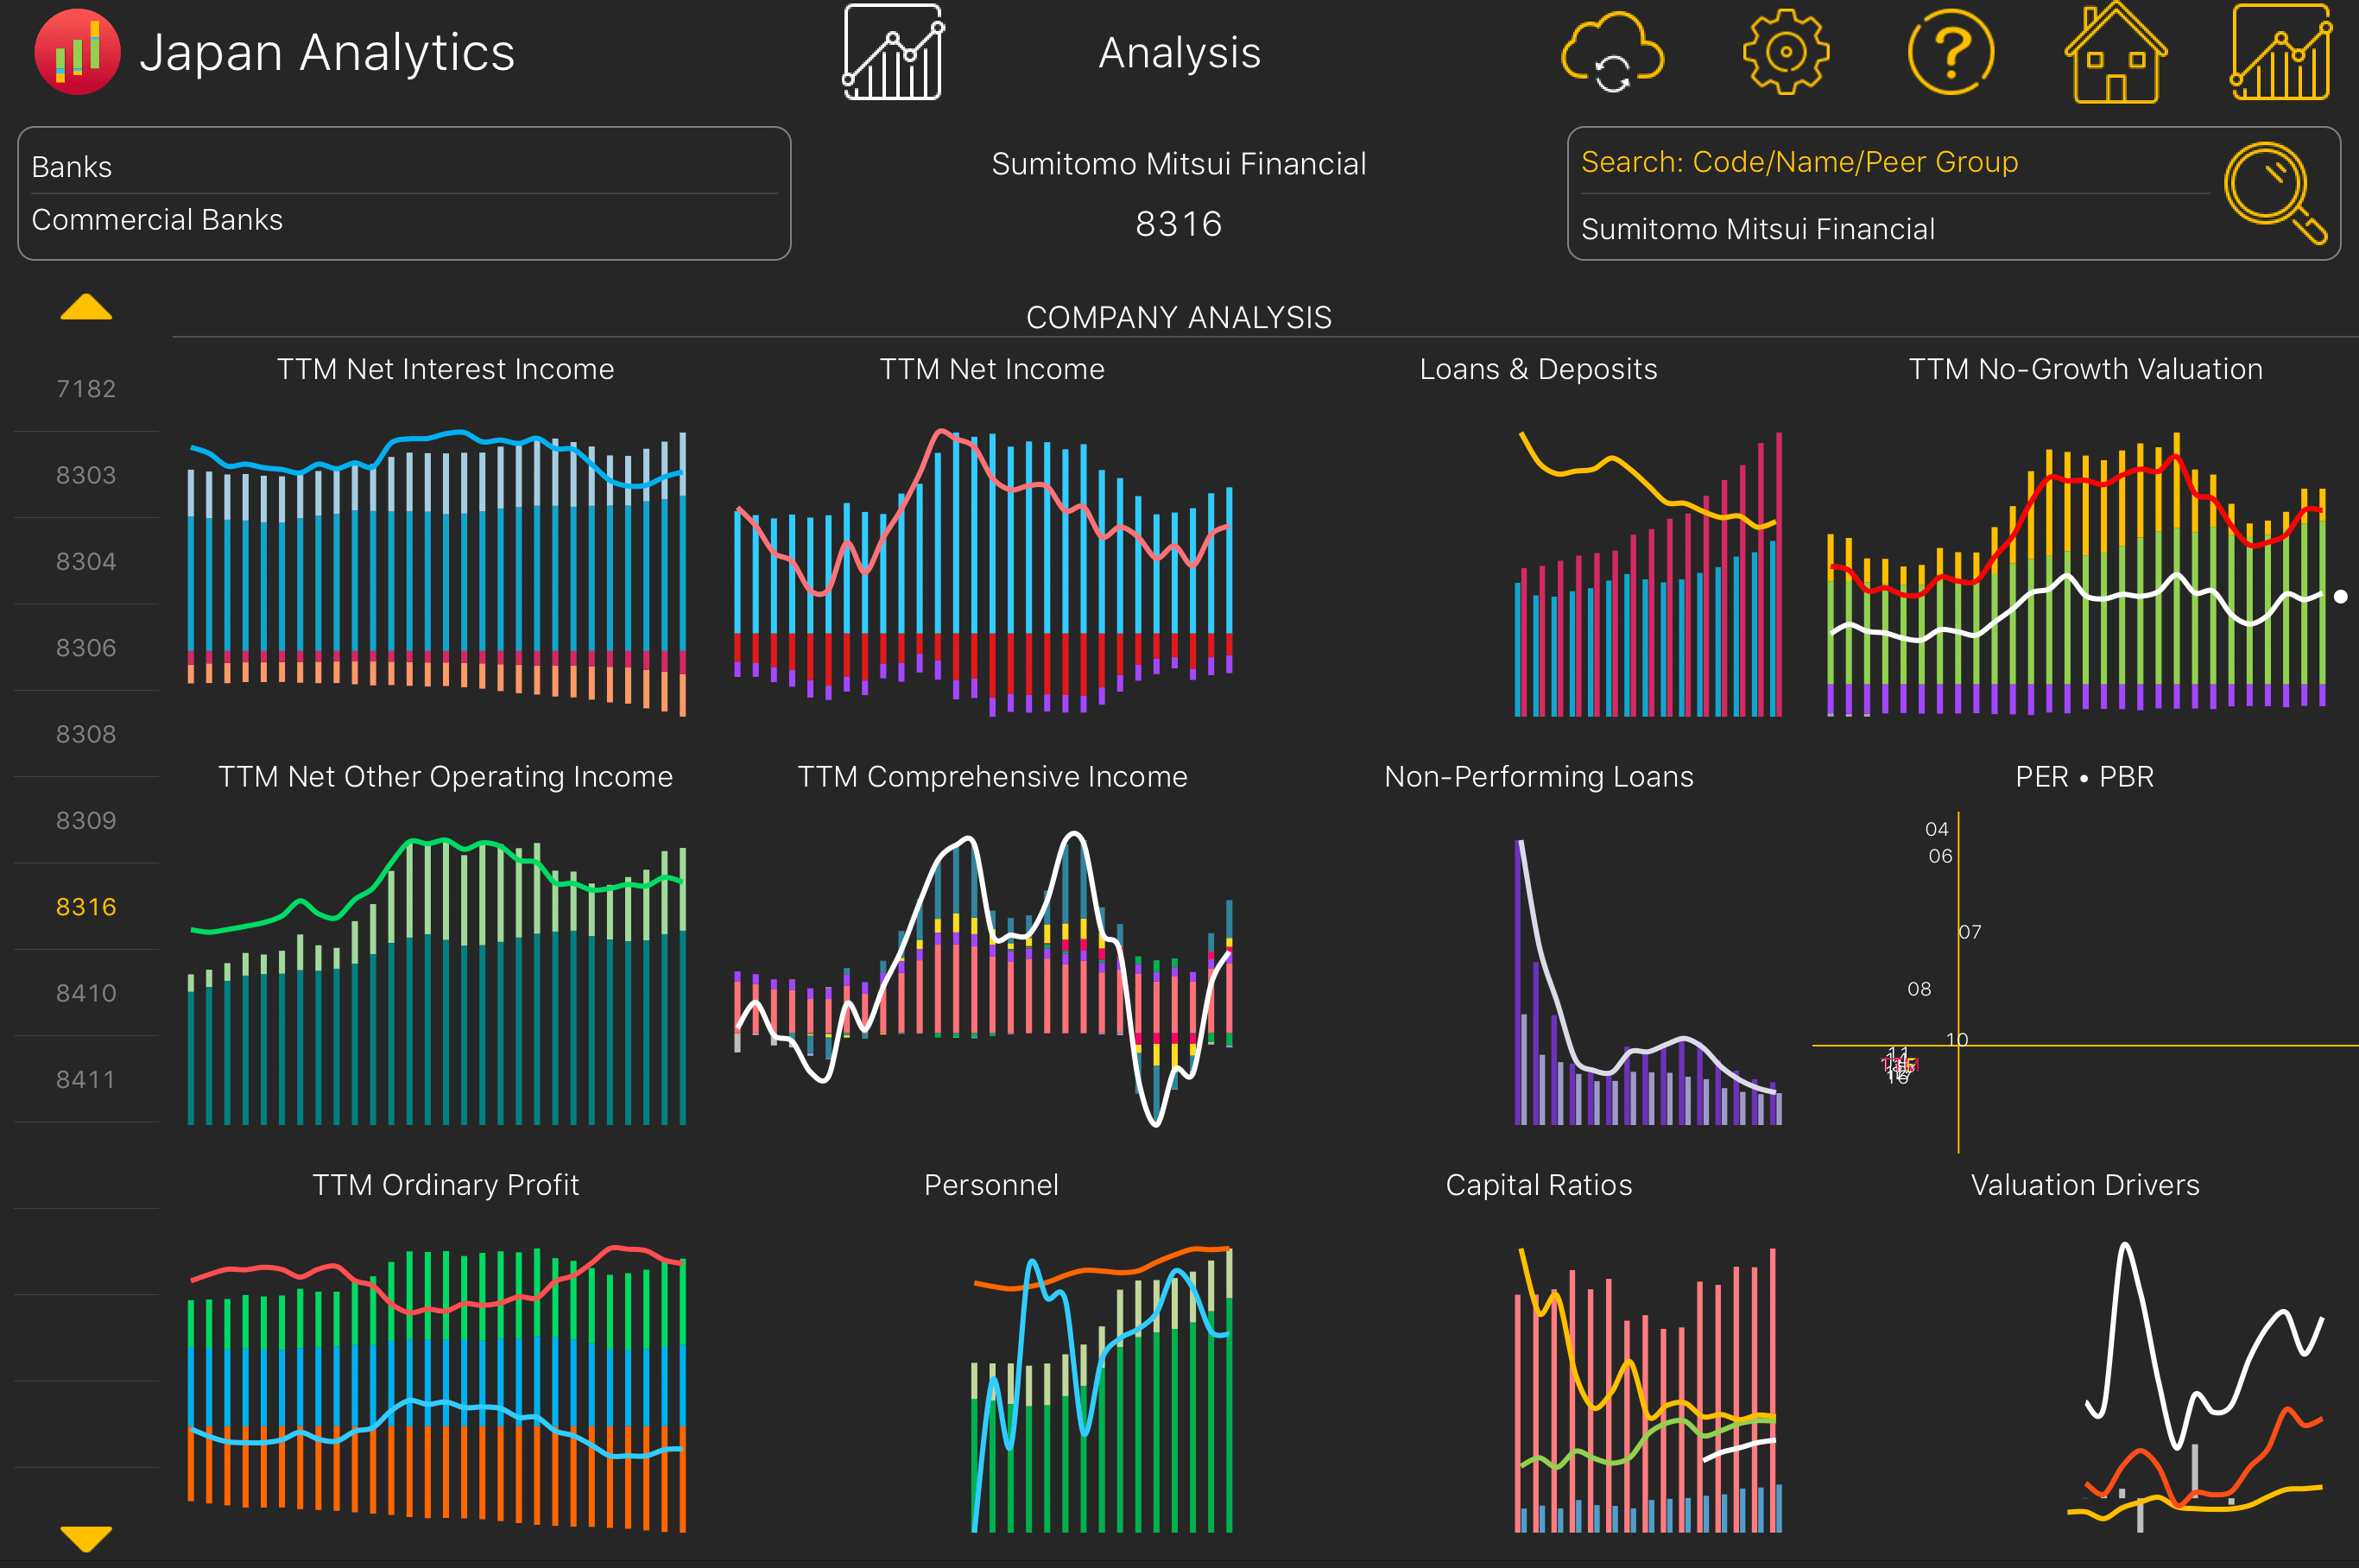
The Banking Company Analysis sub-module has 12 annual or trailing twelve-month (TTM) charts per company with data taken from the company’s financial disclosures. The following provides more detail of the contents of each of the charts.
Net Interest Income - The sum of Loan Income, Other Interest Income, Deposit Expense and Other Interest Expenses. Net Interest Margin is Net Interest Income divided by Average Earning Assets.
Net Other Operating Income - The sum of Net Fee Income, and Other Income, Net and the ratio of Net Other Operating Income to Ordinary Income.
Ordinary Profit - The sum of Net Interest Income, Net Other Income and Operating Expenses, the ratio of Ordinary Profit to Ordinary Income and the Cost/Income Ratio which is Operating Expenses divided by Ordinary Income.
Net Income - The sum of Ordinary Profit, Taxes and Minorities, Extras & Adjustments and the ratio of Net Income to Ordinary Income.
Comprehensive Income - The sum of Net Income and Other Comprehensive Income and the ratio of Comprehensive Income to Common to Ordinary Income.
Personnel - The numbers of permanent and temporary staff are presented as averages together with the ratios of Operating Expenses to Personnel and Ordinary Profit to Personnel in millions of Yen.
Loan & Deposits - The Loan Deposit Ratio and the ratio of Non-Performing Loans to Total Loans is Non-Performing Loans.
Capital Ratios - The Capital Adequacy Ratio, the Tier 1 Capital Ratio and Gross Leverage.
No Growth Valuation - The No-Growth Valuation model is anchored on Book Value to which is added an estimate of the value of future earnings represented by the Residual Income for the period capitalized at 6% assuming that there is no growth in future Residual Income. Residual Income is Ordinary Profit after Tax less a 6% charge on Average Net Assets for the period.
PER & PBR - Up to 28 years of PER and PBR ratios are plotted to illustrate the relationship between growth and risk which together are indicators of expected stock return. Lines have been drawn at a PBR of 1.0 and a PER of 16.67 and their intersection can be considered as the normal valuation for a company with residual income equal to 6% of Net Assets and with no prospects of growth. Where the company has released a forecast of Net Income for the current fiscal year, the PER based on that forecast and the current PBR is labeled as "F."
Valuation Drivers - The key valuation drivers, Cumulative Residual Income and Cumulative Residual Comprehensive Income are compared to the Incremental Market Capitalization plus Dividends Paid from the same starting point up to the latest fiscal year-end. Residual Income is Ordinary Profit After Tax less a charge for the use of the Net Assets used to generate that income. Residual Comprehensive Income is Comprehensive Income to Common Equity less a 6% charge on Shareholders’ Equity. Net Change in Capital shows the impact on changes in Equity & Reserves on Incremental Market Capitalization plus Dividends Paid.
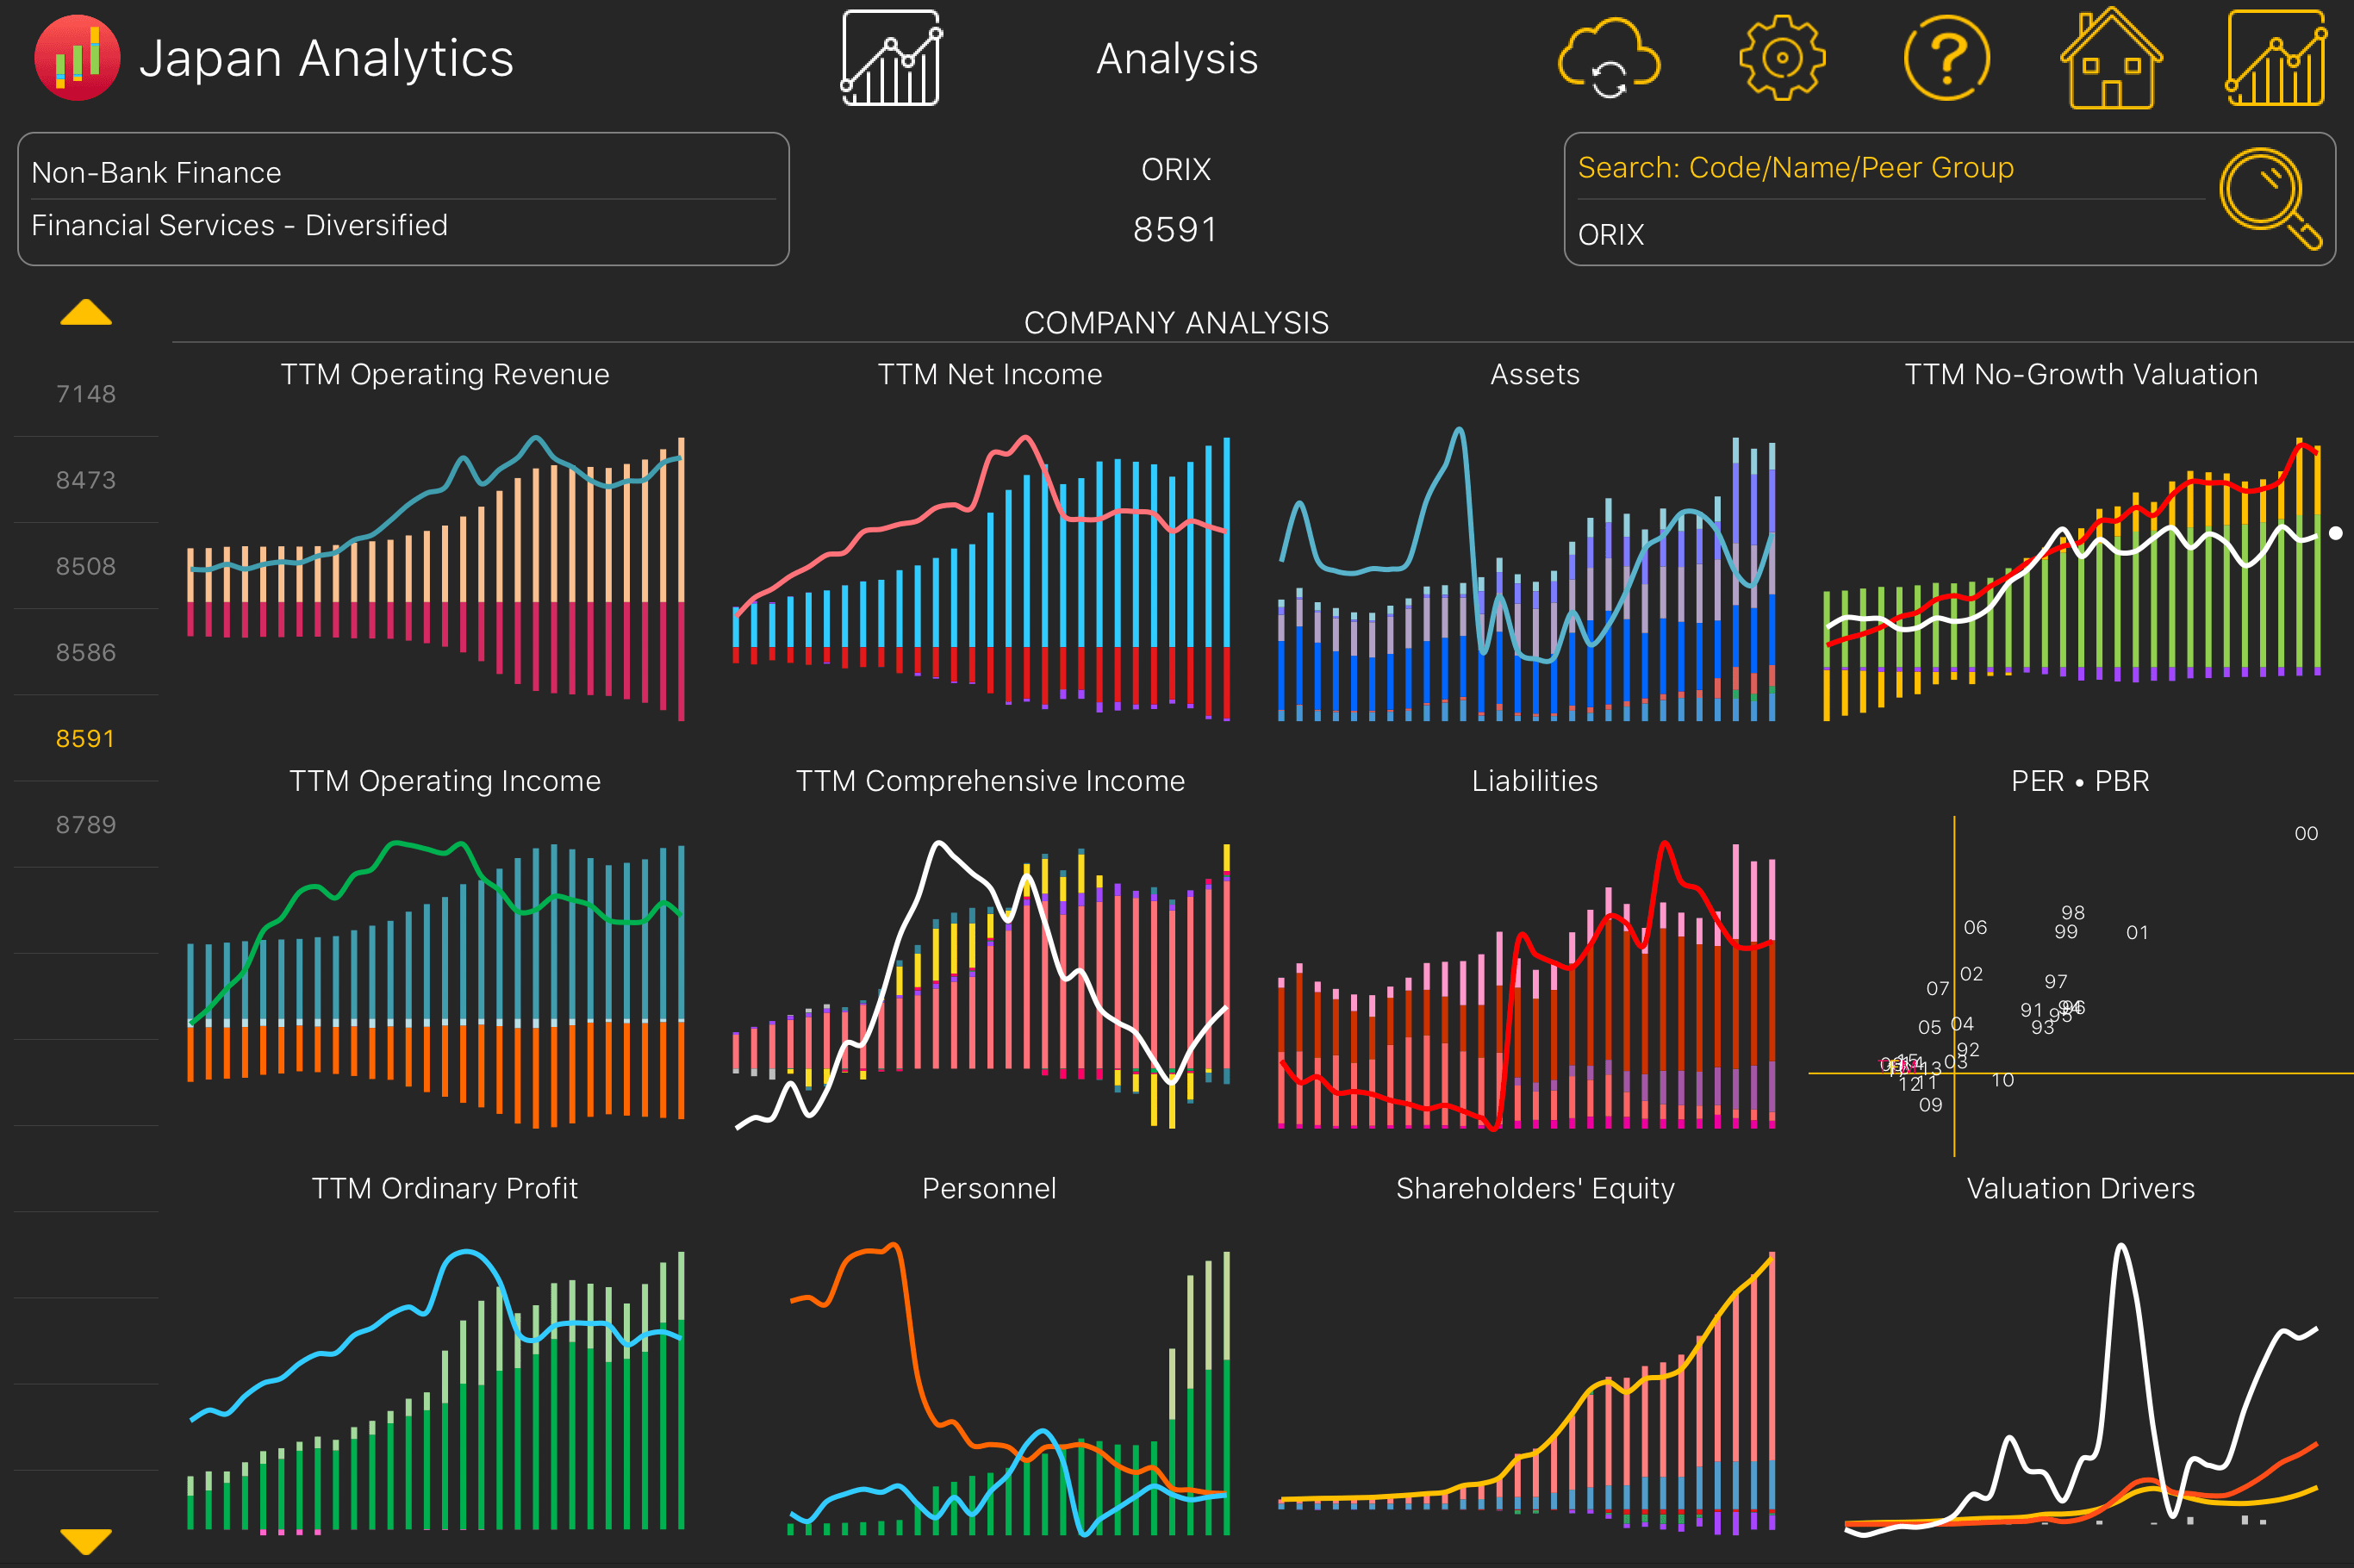
The Other Financing Company Analysis sub-module has 12 annual or trailing twelve-month (TTM) charts per company with data taken from the company’s financial disclosures. The following provides more detail of the contents of each of the charts.
Operating Revenue - Operating Revenue is the sum of revenues from Credit, Leasing, Fees, Loans, Real Estate, Interest & Securities and Other Operating. Operating Costs is the costs associated with generating Operating Revenue. Gross Profit/Total Assets is Gross Profit (Operating Revenue minus Operating Costs) divided by divided by Average Total Assets expressed as a percentage.
Operating Income - The sum of Gross Profit, Other Operating, Net and Operating Expenses and the ratio of Operating Income to Operating Revenue.
Ordinary Profit - The sum of Operating Income, Non-Operating Income and Non-Operating Expenses and the ratio of Ordinary Profit to Operating Revenue.
Net Income - The sum of Ordinary Profit, Taxes, Minorities, Extras & Adjustments and the ratio of Net Income to Operating Revenue.
Comprehensive Income - The sum of Net Income and Other Comprehensive Income and the ratio of Comprehensive Income to Common to Operating Revenue.
Personnel - The numbers of permanent and temporary staff are presented together with the ratios of Ordinary Profit to Personnel and Average Compensation to Personnel in millions of Yen.
Assets - The sum of Cash & Securities, Receivables, Fixed Assets, Loans, Lease Assets, Investments and Other Assets and the ratio of Cash & Securities to Total Assets.
Liabilities - The sum of Payables, Short-Term Debt, Deposits, Securitization, Lease Liabilities, Long-Term Debt and Other Liabilities and the Cost of Interest-Bearing Debt which is Interest Expense divided by Average Interest-Bearing Debt.
Net Assets - The sum of Equity, Reserves, Treasury Stock, Accumulated Comprehensive Income/Adjustments, Minorities & Warrants, Preference Shares and Other. Adjusted Shareholders’ Equity is Net Assets less Amounts deducted from Net Assets such as Minorities, Warrants and Preference Shares.
No Growth Valuation - see Banks above.
PER & PBR - see Banks above.
Valuation Drivers - see Banks above.
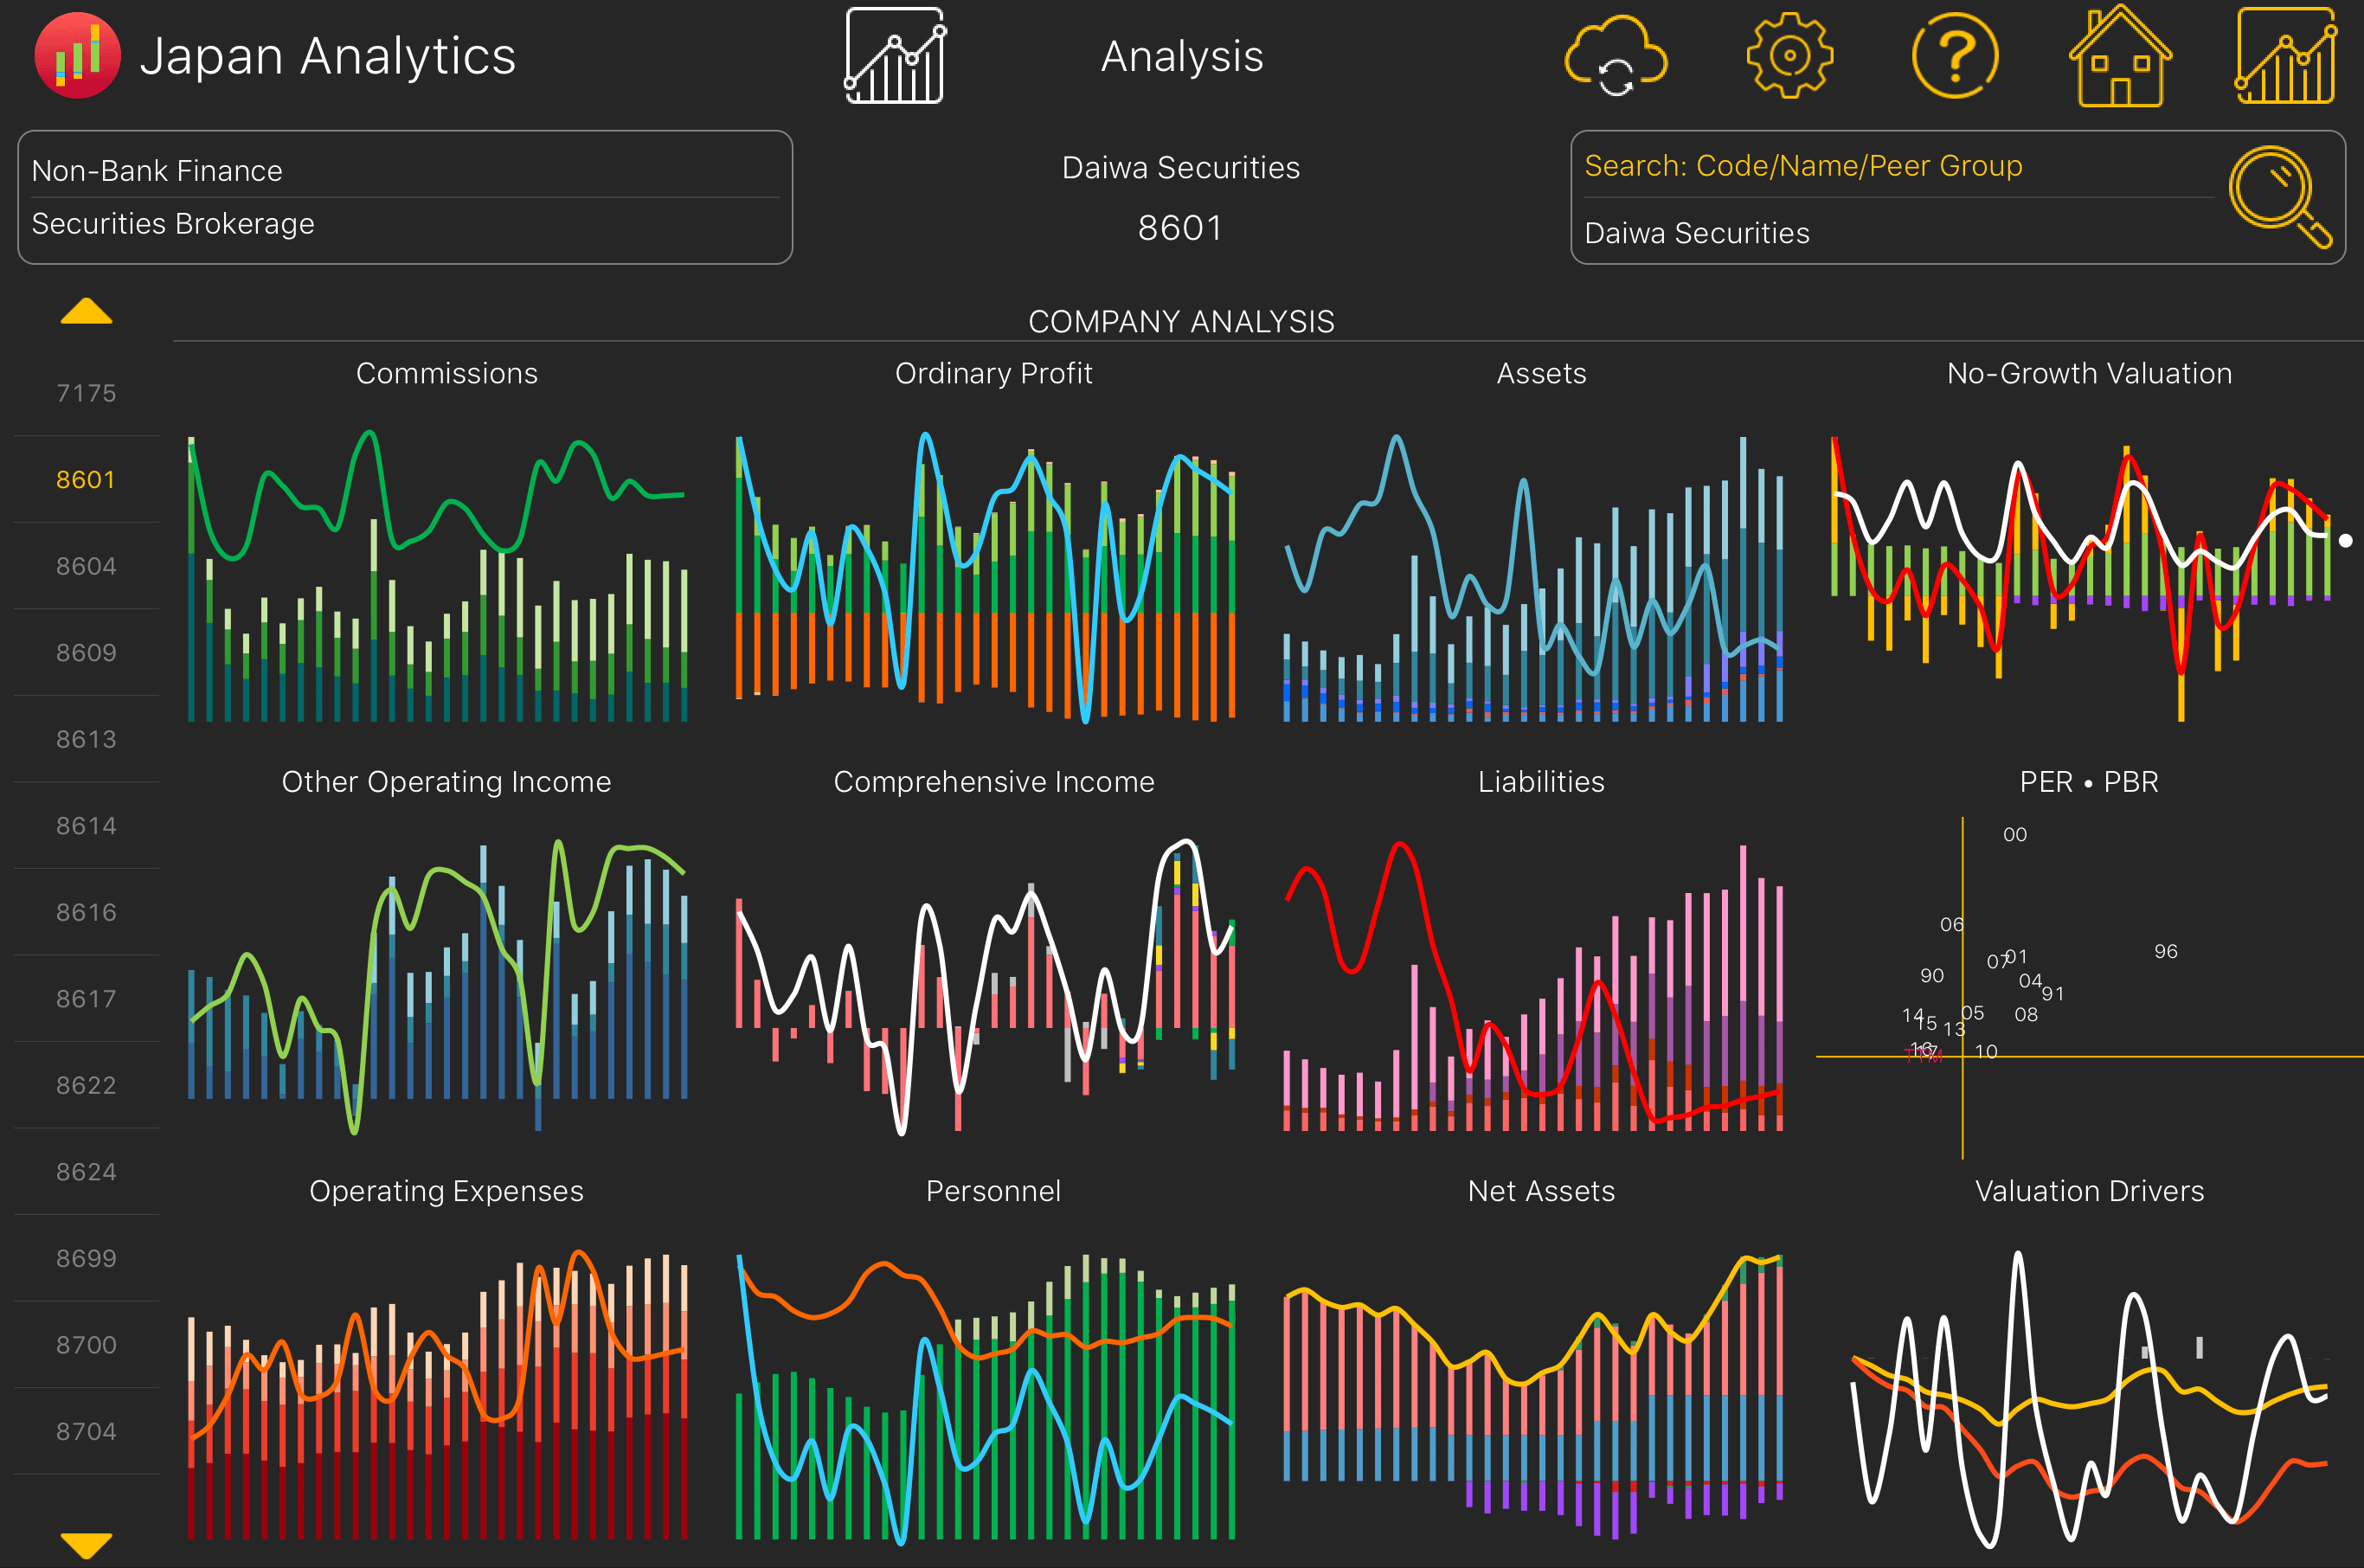
The Securities Company Analysis sub-module has 12 annual or trailing twelve-month (TTM) charts per company with data taken from the company’s financial disclosures. The following provides more detail of the contents of each of the charts.
Commissions - The sum of Brokerage Commissions, Investment Banking Fees and Other Commissions and the ratio of Commission to Operating Revenue.
Other Operating - The sum of Net Trading & Investments Revenue, Net Interest & Dividends and Other Revenue and the ratio of Other Operating Revenue to Operating Revenue.
Operating Expenses - The sum of Compensation, Office Expenses, Trading & Communication Expenses and Other Expenses and the ratio of Operating Expenses to Operating Revenue.
Ordinary Profit - The sum of Commissions, Other Operating Revenue, Operating Expenses and Net Non-Operating Income and Expenses and the ratio of Ordinary Profit to Operating Revenue.
Comprehensive Income - The sum of Net Income and Other Comprehensive Income and the ratio of Comprehensive Income to Common to Operating Revenue.
Personnel - The numbers of permanent and temporary staff are presented together with the ratios of Ordinary Profit to Personnel and Average Compensation to Personnel in millions of Yen.
Assets - The sum of Cash, Fixed Assets, Loans, Investments, Trading Account Assets and Other Assets and the ratio of Net Trading Account to Total Assets.
Liabilities - The sum of Short-Term Debt, Long-Term Debt, Trading Account Liabilities and Other Liabilities and the Cost of Interest-Bearing Debt which is Interest Expense divided by Average Interest-Bearing Debt.
Net Assets - The sum of Equity, Reserves, Treasury Stock, Accumulated Comprehensive Income/Adjustments, Minorities & Warrants, Preference Shares and Other. Adjusted Shareholders’ Equity is Net Assets less Amounts deducted from Net Assets such as Minorities, Warrants and Preference Shares.
No Growth Valuation - see Banks above.
PER & PBR - see Banks above.
Valuation Drivers - see Banks above.
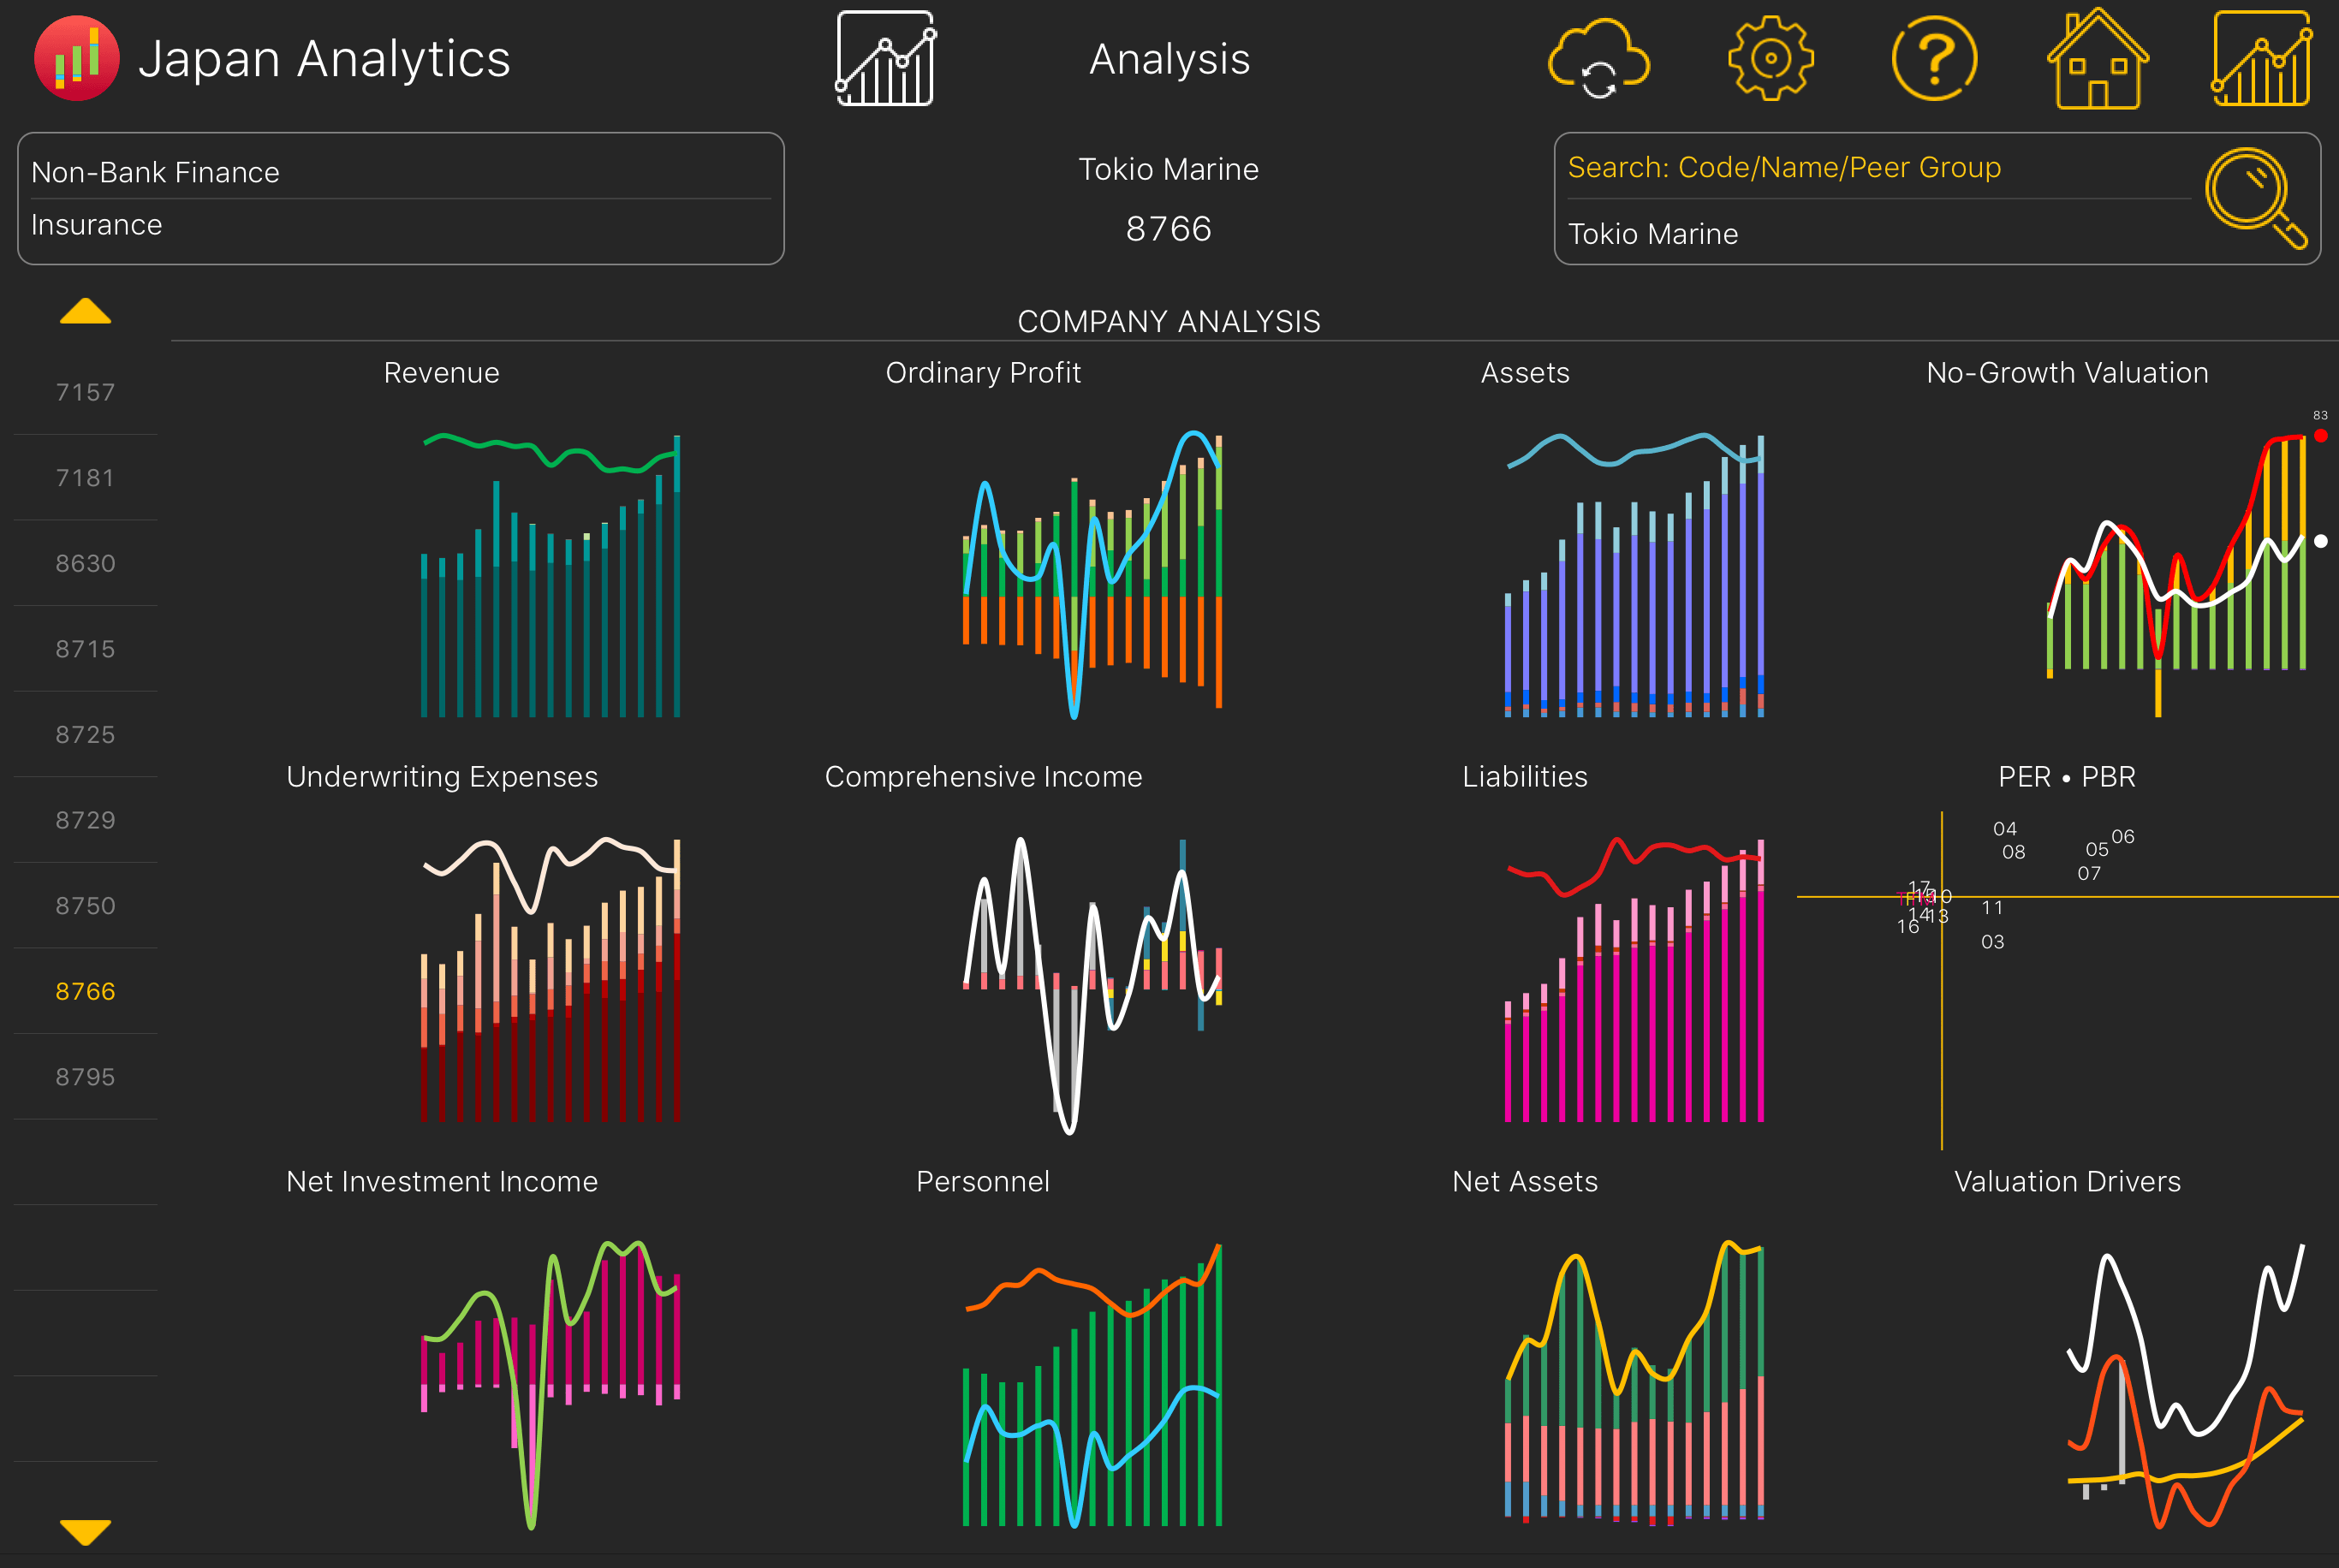
The Insurance Company Analysis sub-module has 12 annual or trailing twelve-month (TTM) charts per company with data taken from the company’s financial disclosures. The following provides more detail of the contents of each of the charts.
Underwriting Revenue - The sum of Net Premiums, Life Policies and Other Underwriting Revenue and the ratio of Underwriting Revenue to Operating Revenue.
Underwriting Expenses - The sum of Claims, Life Claims, Dividends & Refunds, Provisions, Commissions & Other Expenses and the ratio of Underwriting Expenses to Underwriting Revenue also known as the Combined Ratio.
Net Investment Income - Net Investment Income is Investment Income less Investment Expenses and the Investment Yield which is Net Investment Income divided by Average Investments.
Ordinary Profit - The sum of Net Underwriting Revenue, Net Investment Income, Operating Expenses and Net Non-Operating Income and the ratio of Ordinary Profit to Operating Revenue.
Comprehensive Income - The sum of Net Income and Other Comprehensive Income and the ratio of Comprehensive Income to Common to Operating Revenue.
Personnel - The numbers of permanent and temporary staff are presented together with the ratios of Ordinary Profit to Personnel and Operating Expenses to Personnel in millions of Yen.
Assets - The sum of Cash, Fixed Assets, Loans, Investment and Other Assets and the ratio of Investments to Total Assets.
Liabilities - The sum of Policy Reserves, Other Reserves, Long-Term Debt and Other Liabilities and the ratio of Policy Reserves to Total Assets.
Net Assets - The sum of Equity, Reserves, Treasury Stock, Accumulated Comprehensive Income/Adjustments, Minorities & Warrants, Preference Shares and Other. Adjusted Shareholders’ Equity is Net Assets less Amounts deducted from Net Assets such as Minorities, Warrants and Preference Shares.
No Growth Valuation - see Banks above.
PER & PBR - see Banks above.
Valuation Drivers - see Banks above.
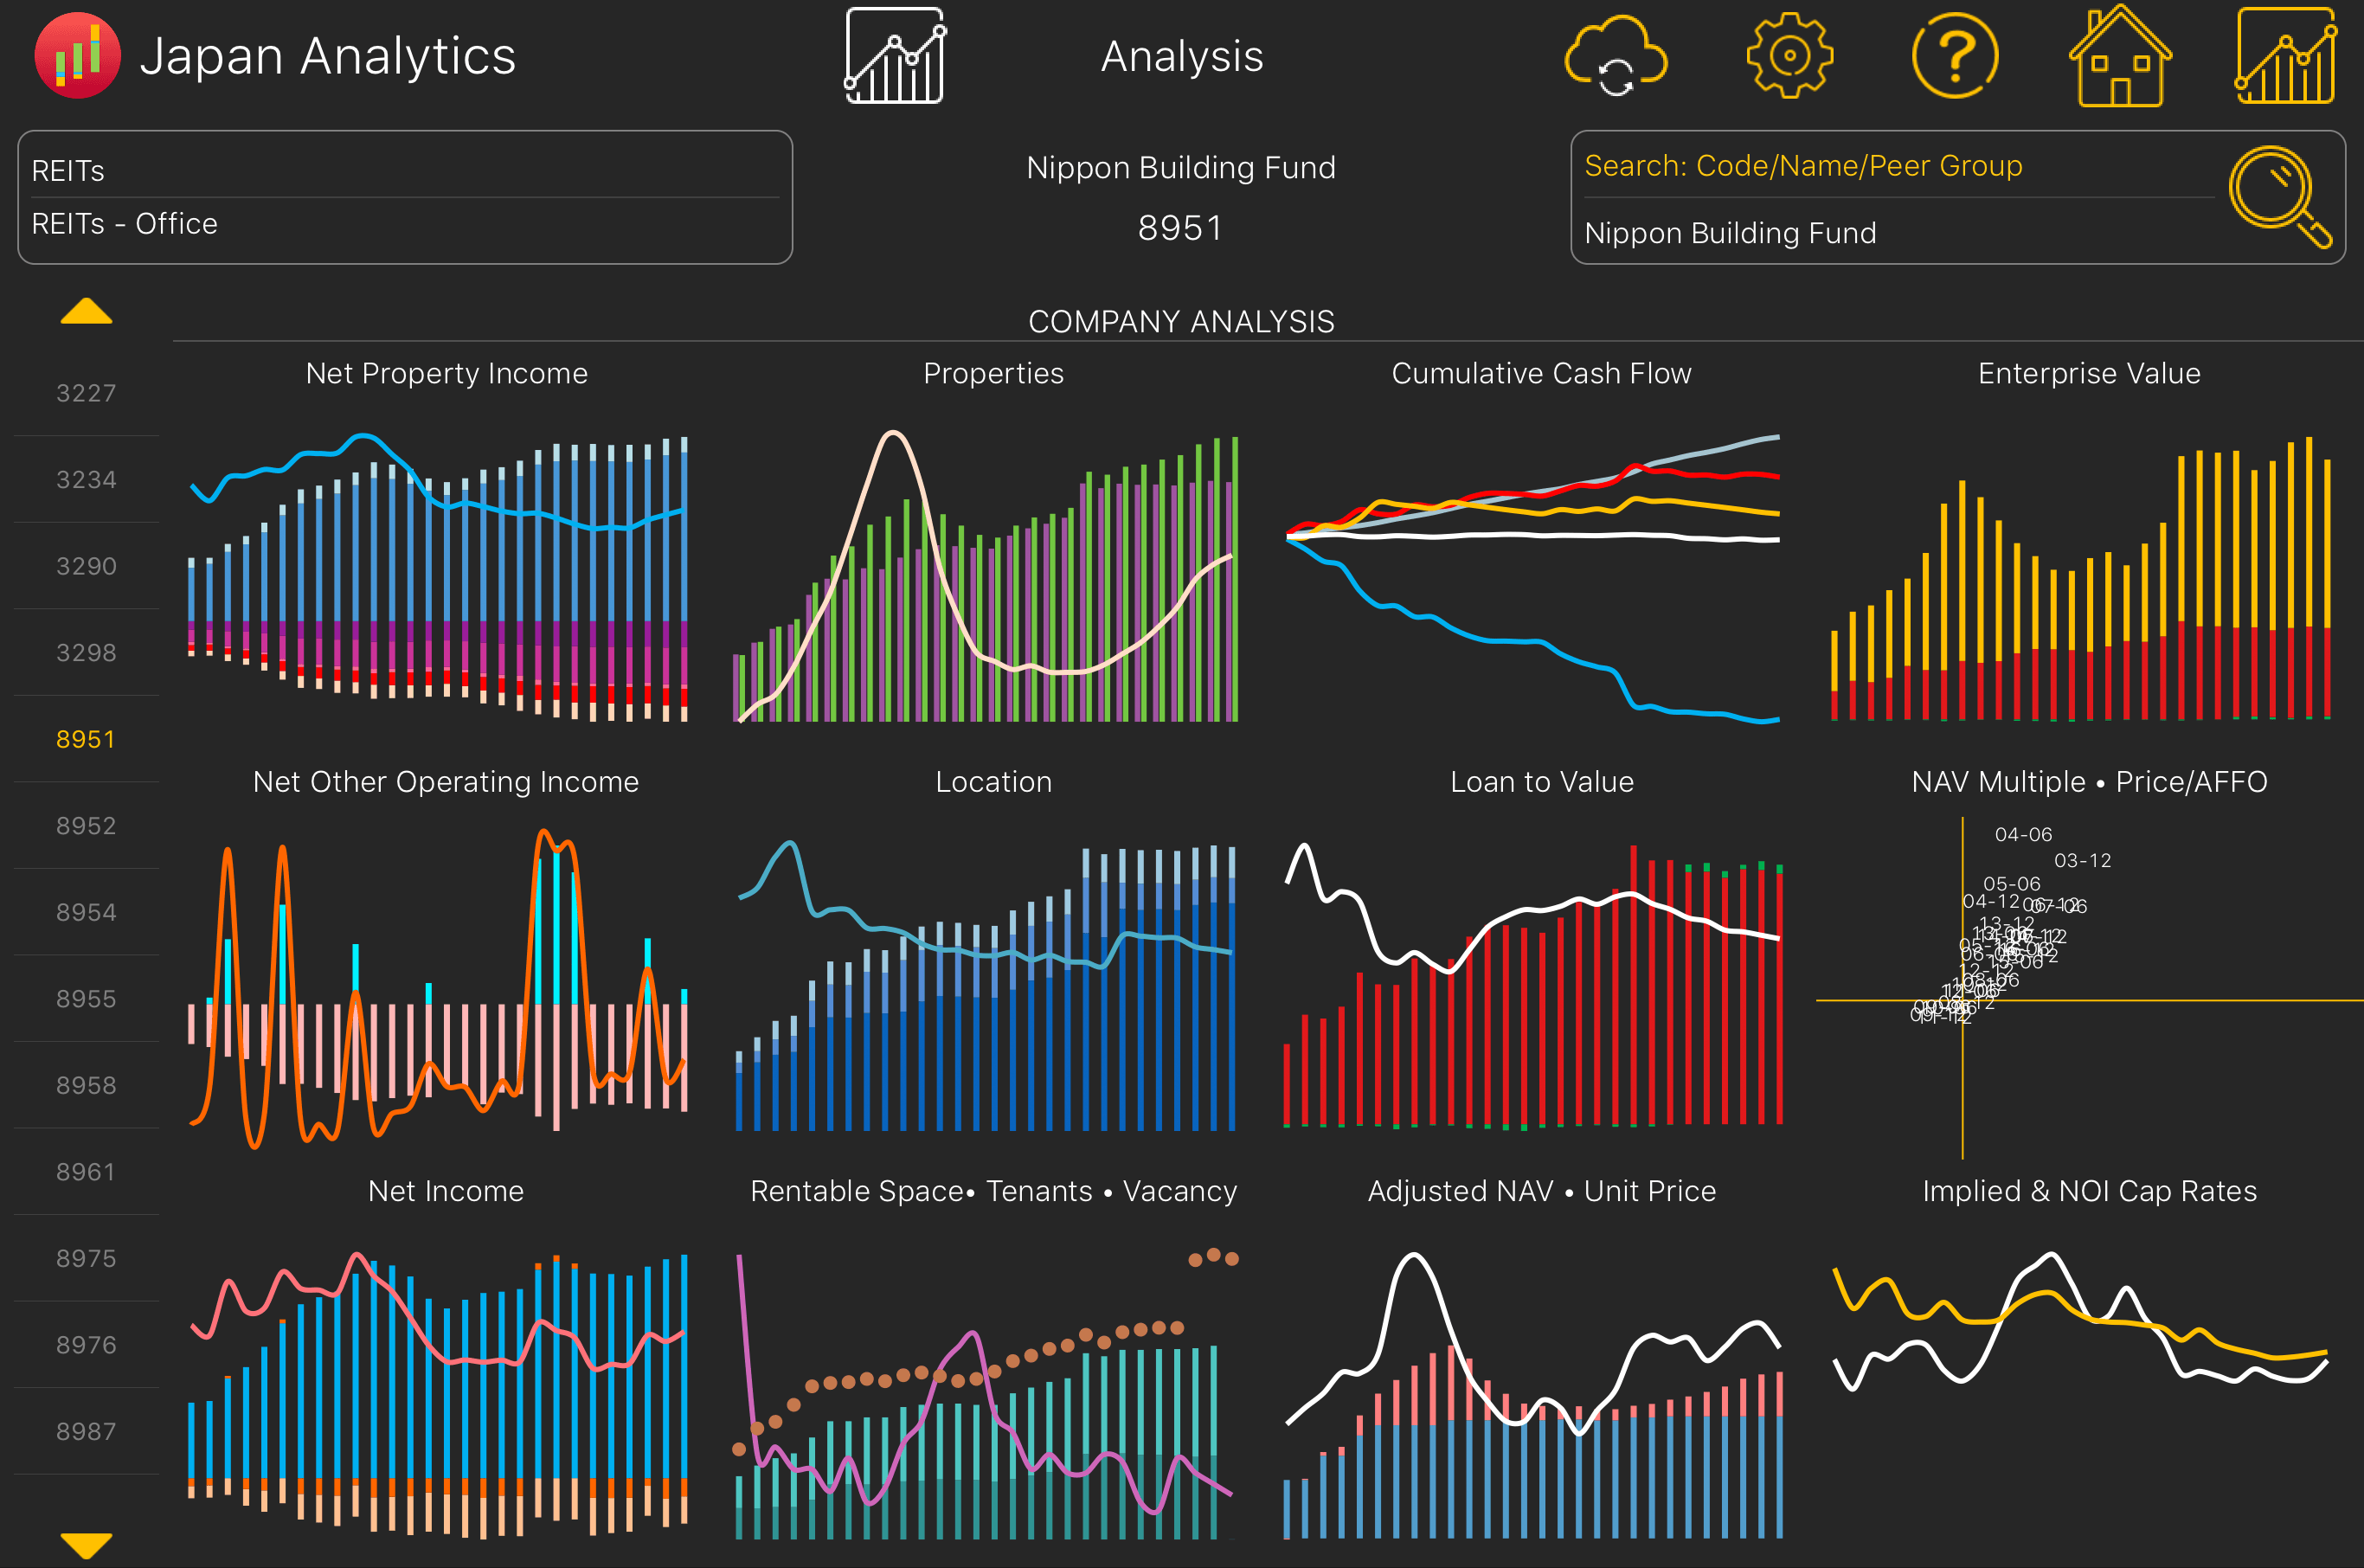
The REITs Company Analysis sub-module has 12 annual or trailing twelve-month (TTM) charts per company with data taken from the company’s financial disclosures. The following provides more detail of the contents of each of the charts.
Net Property Income - The sum of Rent, Other Property Revenue less Management Expenses, Depreciation, Maintenance, Taxes and Other Expenses and the ratio of Net Property Income to Total Assets.
Net Other Operating Income - The sum of Other Operating Revenue and Other Operating Expenses and the ratio of Net Other Operating Income to Total Assets.
Net Income - The sum of Net Property Income, Net Other Operating Income and Net Non-Operating Income and Expenses and the ratio of Net Income to Total Assets.
Properties - Unrealized Profit/(Loss)/Adjusted Net Asset Value is Unrealized Profit or Loss divided by Adjusted Net Asset Value.
Location - The breakdown of the property portfolio between Central Tokyo, Other Tokyo and Other Japan. Other Japan/Total is the ratio of the property portfolio that is not in Tokyo.
Rentable Space • Tenants • Vacancy - The Rentable Space in terms of thousand square meters divided into the cumulative rentable space occupied by the Top 10 tenants and Other Tenants, the number of Tenants and the percentage of the property portfolio that is vacant other than zero.
Cumulative Cash Flow - Operating, Investing, Financing and Shareholder Cash Flow and Change in Cash accumulated from the Statement of Cash Flows.
Loan to Value - The Loan/Value Ratio is the ratio of Debt and Security Deposits to Appraisal Value and Cash.
Adjusted NAV & Unit Price - The Adjusted Net Asset Value Per Share is the sum of Contribution Capital per Share and Unrealized Profit/Loss per Share. Closing Unit Price is the latest closing price of one Unit of the REIT.
Enterprise Value - The sum of Deposits less Cash, Debt and Market Capitalization.
NAV Multiple and Price/AFFO - NAV Multiple is the latest Market Capitalization divided by the Adjusted Net Asset Value. Price/AFFO is the latest Market Capitalization divided by the sum of Net Income and Depreciation less Net Property Sale Gains and Recurring Capital Expenditures.
Implied & NOI Cap Rates - The Implied Cap Rate is the Annualized Net Property Income divided by Market Capitalization plus Net Debt expressed as a percentage. NOI/Appraisal Value is Net Property Income divided by Appraisal Value expressed as a percentage.