Forecasts

Forecasts Module
Management forecasts are a particular feature of the Japanese market and have been the subject of much academic research. The practice originated in 1965 with the Tokyo Stock Exchange (TSE) journalists 'kisha-club' and the convention was incorporated into TSE rules in 1974. Although there is no official listing requirement to issue forecasts, 95% of listed companies issue forecasts which in most cases cover sales, operating income, recurring income, net income, EPS and dividends. The rules were relaxed in 2012 to allow for more flexibility in presentation. In addition, a reason is no longer required for failing to issue any forecasts.
As 75% of Japanese companies are either uncovered or are only followed by one sell-side analyst, management forecasts are the main source of information on earnings prospects in Japan. In addition, analysts of covered companies tend to 'herd' around management forecasts. According to one academic study (Ota, 2010), 90% of changes in analysts' forecasts are explained by changes in management forecasts.
Initial forecasts are made at the time of filing the annual Kessan-Tanshin. Almost all companies revise their forecasts at least once during the fiscal year and 90% do so at least 3 times to coincide with quarterly earnings announcements. TSE rules require forecasts to be revised if expectations deviate by more than 10% for sales and 30% for profits from the current forecast. Sales deviation-based revisions are rare (5% of cases) but around a quarter of revisions are driven by significant changes in profits (60% downwards) and more than two-thirds of these are announced between quarterly earnings releases.
Japanese company earnings forecasts are an interesting study in behavioral psychology. Over 75% of initial forecasts exceed the results for the previous year and consensus forecasts with this tendency being most pronounced in companies with poor previous results. Accordingly, two-thirds of revisions are downward and are designed to manage previous 'errors' towards an ultimate aggregate error of zero. Forecasts are therefore systematically positive and overly optimistic, with voluntary revisions being designed to manage expectations and limit surprises.
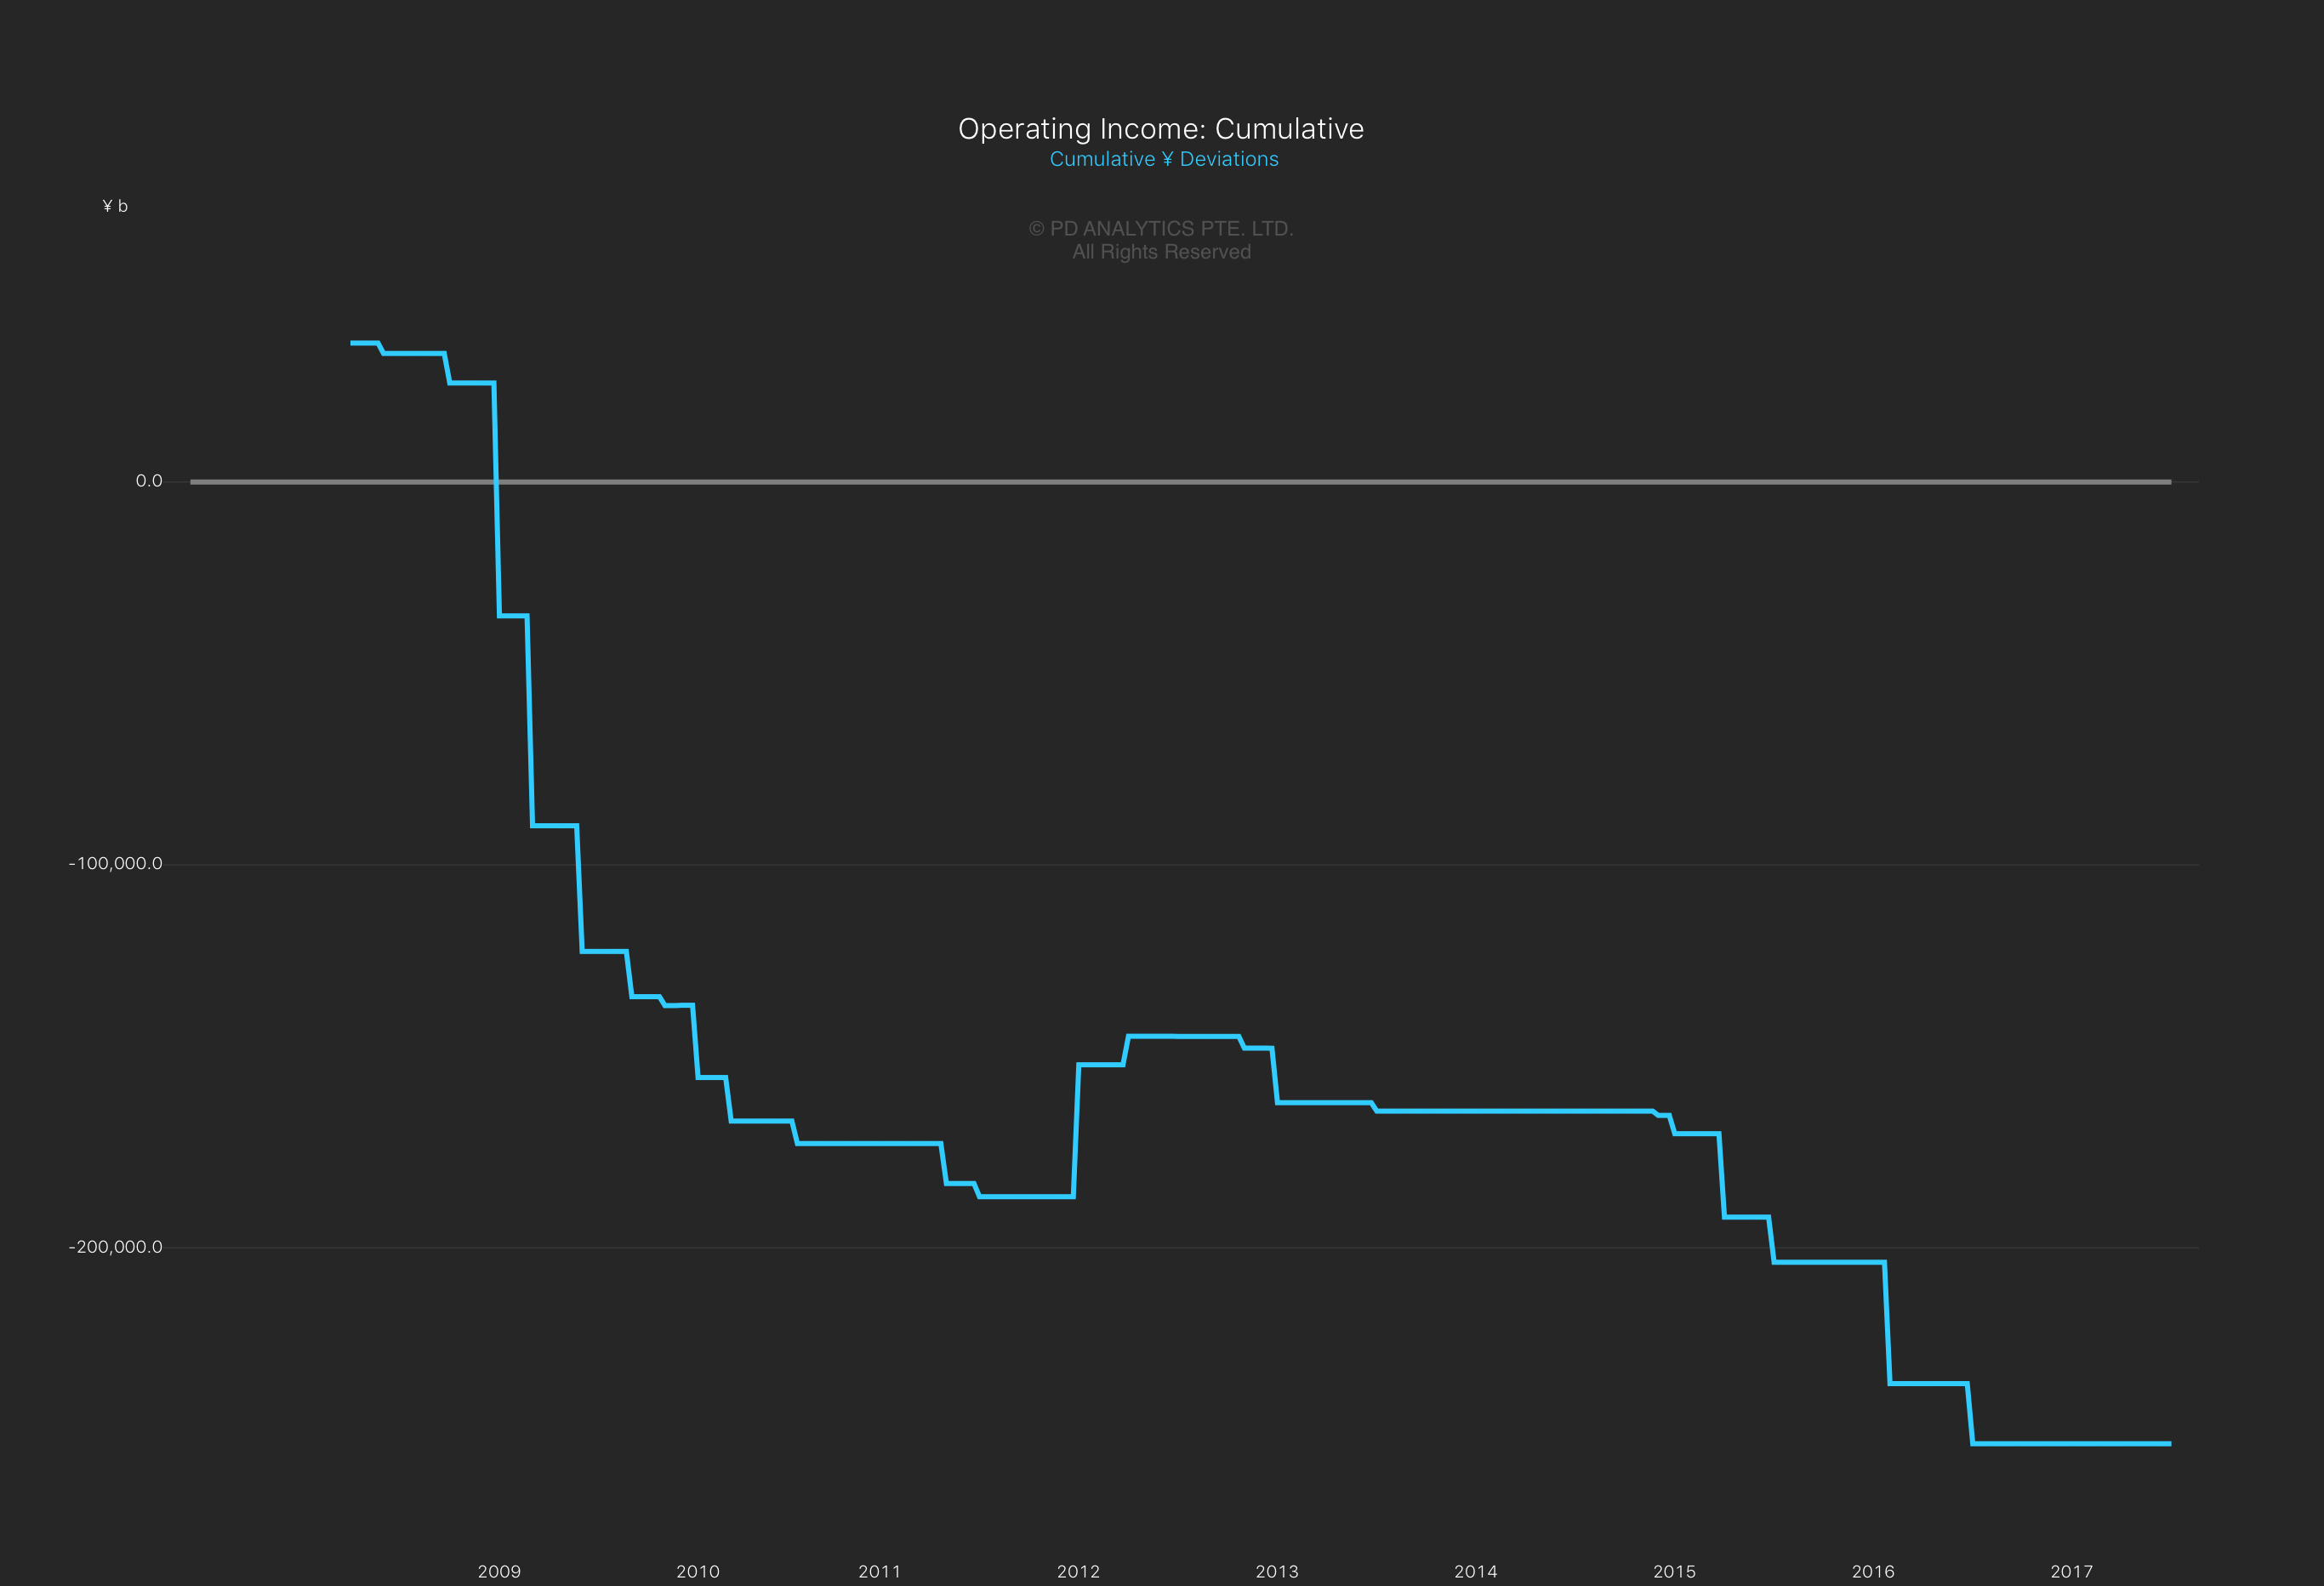
The Japan Analytics Forecasts Module shows every quarterly and irregular forecast for Revenue, Operating Profit, Operating Margin and Net Income that have been released by all currently listed company since 2008. Forecasts are mapped on a timeline and compared with the actual results for each fiscal period. Deviations from actual results are shown on a separate chart with over-estimates marked in red and under-estimates in green. A third chart presents the cumulative deviations over time.
Forecasts v. Results

Deviations

Cumulative Deviations

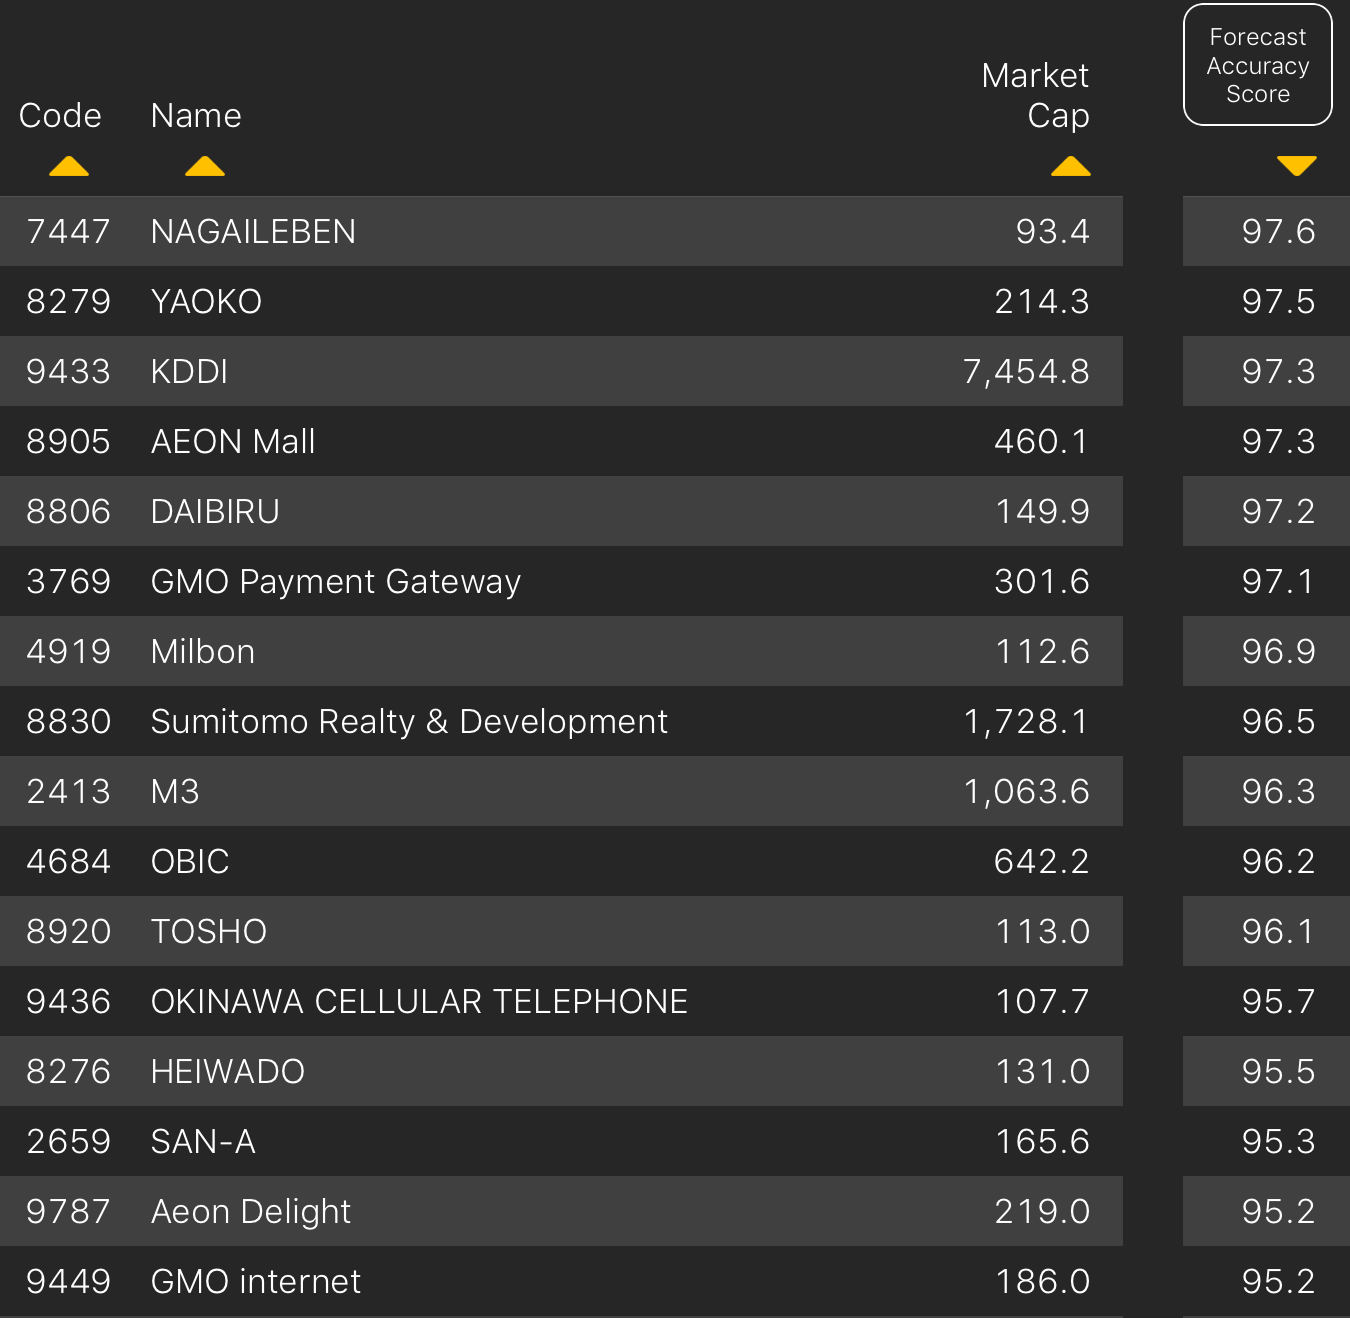
Forecast Accuracy Score
The Japan Analytics Forecast Accuracy Score is a measure of a company's forecasting ability. Every revenue and operating income forecast is scored and accumulated. The score is not weighted based on frequency and does not take the proximity of forecasts to the annual results announcement into account.
Forecasts of recurring profit, net income and earnings per share have been excluded from the calculation. Net income tends to be more volatile due to the impact of extraordinary items and net income forecasts have been shown to be subject to the greatest amount of management bias.
The score has a maximum of 100 for perfect accuracy. There is no minimum. The score can be used to weight a company's current forecasts, especially if there are large deviations between management forecasts and the trailing twelve-month results. The score can also be considered as a measure of business stability or volatility. The tables below from the Screening Module show the current highest and lowest Forecast Accuracy Scores for larger cap companies.

